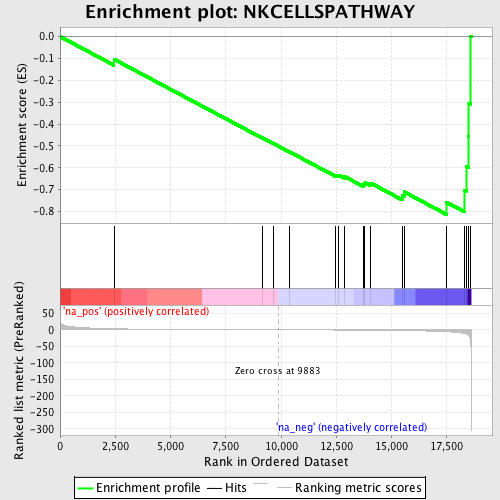
Profile of the Running ES Score & Positions of GeneSet Members on the Rank Ordered List
| Dataset | set04_DMpreB_versus_WTpreB |
| Phenotype | NoPhenotypeAvailable |
| Upregulated in class | na_neg |
| GeneSet | NKCELLSPATHWAY |
| Enrichment Score (ES) | -0.81372654 |
| Normalized Enrichment Score (NES) | -1.950672 |
| Nominal p-value | 0.010204081 |
| FDR q-value | 0.31263733 |
| FWER p-Value | 0.654 |
| PROBE | GENE SYMBOL | GENE_TITLE | RANK IN GENE LIST | RANK METRIC SCORE | RUNNING ES | CORE ENRICHMENT | |
|---|---|---|---|---|---|---|---|
| 1 | ITGB1 | 2439 | 2.968 | -0.1038 | No | ||
| 2 | PAK1 | 9149 | 0.183 | -0.4629 | No | ||
| 3 | KLRC1 | 9652 | 0.061 | -0.4893 | No | ||
| 4 | LAT | 10401 | -0.130 | -0.5283 | No | ||
| 5 | MAP2K1 | 12474 | -0.704 | -0.6332 | No | ||
| 6 | KLRC3 | 12606 | -0.746 | -0.6334 | No | ||
| 7 | PIK3R1 | 12882 | -0.833 | -0.6405 | No | ||
| 8 | RAC1 | 13719 | -1.142 | -0.6750 | No | ||
| 9 | KLRC2 | 13798 | -1.181 | -0.6683 | No | ||
| 10 | KLRD1 | 14069 | -1.307 | -0.6708 | No | ||
| 11 | B2M | 15485 | -2.188 | -0.7267 | No | ||
| 12 | PIK3CA | 15572 | -2.276 | -0.7104 | No | ||
| 13 | MAPK3 | 17495 | -6.022 | -0.7583 | Yes | ||
| 14 | VAV1 | 18300 | -10.774 | -0.7024 | Yes | ||
| 15 | SYK | 18377 | -12.306 | -0.5932 | Yes | ||
| 16 | PTK2B | 18488 | -15.600 | -0.4556 | Yes | ||
| 17 | PTPN6 | 18504 | -16.488 | -0.3046 | Yes | ||
| 18 | IL18 | 18579 | -33.750 | 0.0020 | Yes |
