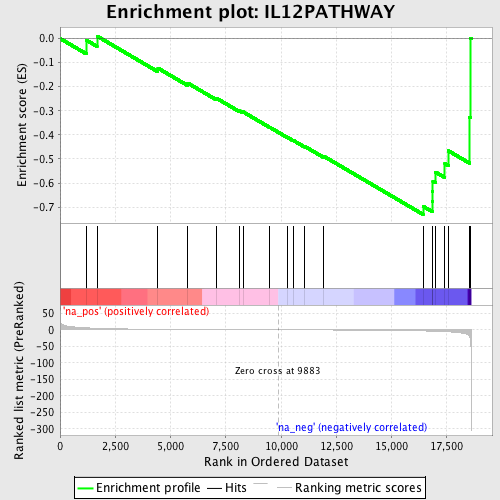
Profile of the Running ES Score & Positions of GeneSet Members on the Rank Ordered List
| Dataset | set04_DMpreB_versus_WTpreB |
| Phenotype | NoPhenotypeAvailable |
| Upregulated in class | na_neg |
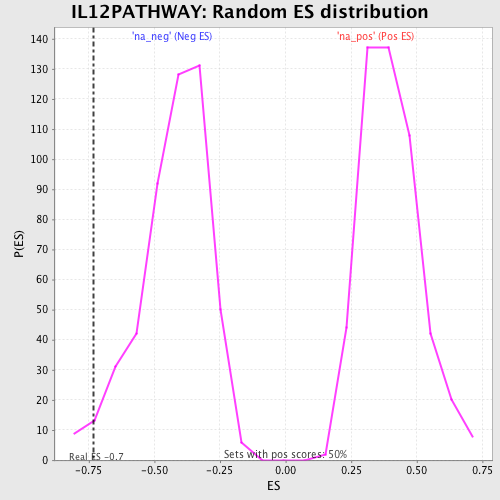
| GeneSet | IL12PATHWAY |
| Enrichment Score (ES) | -0.7305938 |
| Normalized Enrichment Score (NES) | -1.725187 |
| Nominal p-value | 0.01992032 |
| FDR q-value | 0.33004436 |
| FWER p-Value | 0.988 |
| PROBE | GENE SYMBOL | GENE_TITLE | RANK IN GENE LIST | RANK METRIC SCORE | RUNNING ES | CORE ENRICHMENT | |
|---|---|---|---|---|---|---|---|
| 1 | IL12RB1 | 1185 | 5.805 | -0.0067 | No | ||
| 2 | MAPK8 | 1673 | 4.351 | 0.0099 | No | ||
| 3 | IL18R1 | 4427 | 1.539 | -0.1230 | No | ||
| 4 | CCR5 | 5774 | 1.069 | -0.1849 | No | ||
| 5 | CD3E | 7061 | 0.707 | -0.2471 | No | ||
| 6 | TRB@ | 8136 | 0.423 | -0.3007 | No | ||
| 7 | IL12RB2 | 8282 | 0.390 | -0.3046 | No | ||
| 8 | CD3D | 9498 | 0.093 | -0.3690 | No | ||
| 9 | CXCR3 | 10280 | -0.097 | -0.4101 | No | ||
| 10 | IL12B | 10559 | -0.169 | -0.4234 | No | ||
| 11 | CD3G | 11065 | -0.311 | -0.4475 | No | ||
| 12 | STAT4 | 11939 | -0.543 | -0.4891 | No | ||
| 13 | TYK2 | 16431 | -3.429 | -0.6969 | Yes | ||
| 14 | JUN | 16845 | -4.286 | -0.6770 | Yes | ||
| 15 | IFNG | 16860 | -4.309 | -0.6354 | Yes | ||
| 16 | MAPK14 | 16874 | -4.333 | -0.5935 | Yes | ||
| 17 | MAP2K6 | 16991 | -4.589 | -0.5546 | Yes | ||
| 18 | IL12A | 17415 | -5.813 | -0.5202 | Yes | ||
| 19 | JAK2 | 17579 | -6.349 | -0.4665 | Yes | ||
| 20 | ETV5 | 18533 | -19.367 | -0.3274 | Yes | ||
| 21 | IL18 | 18579 | -33.750 | 0.0020 | Yes |