Profile of the Running ES Score & Positions of GeneSet Members on the Rank Ordered List
| Dataset | set04_DMpreB_versus_WTpreB |
| Phenotype | NoPhenotypeAvailable |
| Upregulated in class | na_neg |
| GeneSet | HSA04130_SNARE_INTERACTIONS_IN_VESICULAR_TRANSPORT |
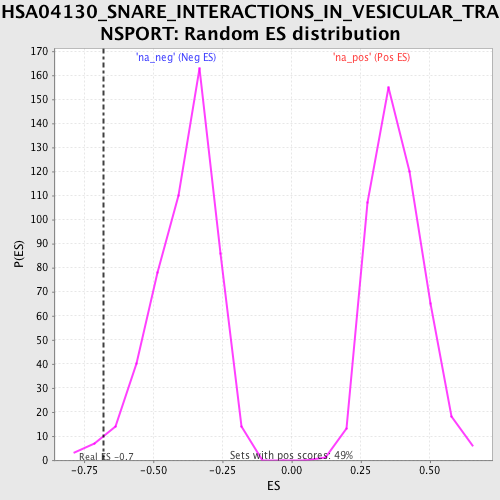
| Enrichment Score (ES) | -0.6789867 |
| Normalized Enrichment Score (NES) | -1.7478408 |
| Nominal p-value | 0.017475728 |
| FDR q-value | 0.35607094 |
| FWER p-Value | 0.986 |
| PROBE | GENE SYMBOL | GENE_TITLE | RANK IN GENE LIST | RANK METRIC SCORE | RUNNING ES | CORE ENRICHMENT | |
|---|---|---|---|---|---|---|---|
| 1 | VTI1A | 1307 | 5.383 | -0.0222 | No | ||
| 2 | STX18 | 3192 | 2.217 | -0.1038 | No | ||
| 3 | BNIP1 | 5899 | 1.034 | -0.2401 | No | ||
| 4 | STX12 | 6433 | 0.872 | -0.2610 | No | ||
| 5 | STX17 | 7136 | 0.688 | -0.2926 | No | ||
| 6 | STX16 | 7803 | 0.512 | -0.3239 | No | ||
| 7 | STX4 | 9168 | 0.179 | -0.3957 | No | ||
| 8 | BET1 | 9746 | 0.038 | -0.4264 | No | ||
| 9 | STX3 | 11639 | -0.468 | -0.5240 | No | ||
| 10 | VTI1B | 12060 | -0.574 | -0.5414 | No | ||
| 11 | GOSR1 | 13204 | -0.950 | -0.5944 | No | ||
| 12 | SEC22B | 14088 | -1.313 | -0.6302 | No | ||
| 13 | VAMP1 | 14116 | -1.329 | -0.6198 | No | ||
| 14 | VAMP2 | 14175 | -1.356 | -0.6108 | No | ||
| 15 | STX11 | 14751 | -1.665 | -0.6269 | No | ||
| 16 | VAMP3 | 14867 | -1.728 | -0.6176 | No | ||
| 17 | STX6 | 16009 | -2.751 | -0.6544 | Yes | ||
| 18 | SNAP25 | 16013 | -2.755 | -0.6300 | Yes | ||
| 19 | STX8 | 16113 | -2.879 | -0.6096 | Yes | ||
| 20 | STX2 | 16675 | -3.904 | -0.6049 | Yes | ||
| 21 | VAMP8 | 17056 | -4.732 | -0.5830 | Yes | ||
| 22 | STX7 | 17675 | -6.666 | -0.5567 | Yes | ||
| 23 | GOSR2 | 17698 | -6.741 | -0.4976 | Yes | ||
| 24 | SNAP23 | 17906 | -7.684 | -0.4401 | Yes | ||
| 25 | SNAP29 | 17997 | -8.251 | -0.3712 | Yes | ||
| 26 | VAMP4 | 18237 | -10.317 | -0.2919 | Yes | ||
| 27 | STX5 | 18243 | -10.352 | -0.1997 | Yes | ||
| 28 | VAMP5 | 18351 | -11.534 | -0.1024 | Yes | ||
| 29 | BET1L | 18412 | -13.049 | 0.0110 | Yes |