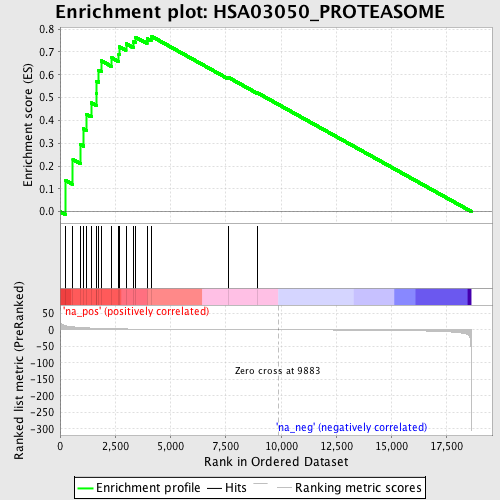
Profile of the Running ES Score & Positions of GeneSet Members on the Rank Ordered List
| Dataset | set04_DMpreB_versus_WTpreB |
| Phenotype | NoPhenotypeAvailable |
| Upregulated in class | na_pos |
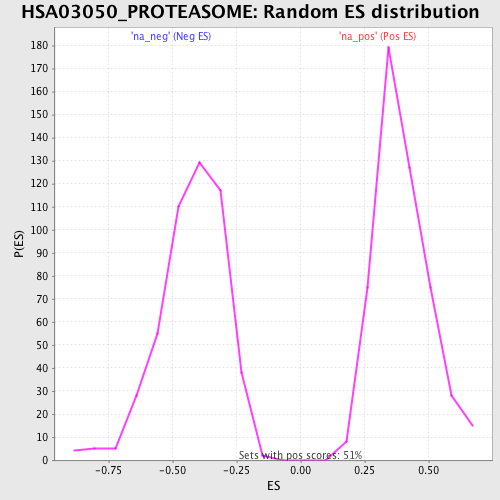
| GeneSet | HSA03050_PROTEASOME |
| Enrichment Score (ES) | 0.76954436 |
| Normalized Enrichment Score (NES) | 1.9472042 |
| Nominal p-value | 0.0 |
| FDR q-value | 0.0011473299 |
| FWER p-Value | 0.018 |
| PROBE | GENE SYMBOL | GENE_TITLE | RANK IN GENE LIST | RANK METRIC SCORE | RUNNING ES | CORE ENRICHMENT | |
|---|---|---|---|---|---|---|---|
| 1 | PSMA7 | 233 | 12.156 | 0.1375 | Yes | ||
| 2 | PSMD2 | 581 | 8.853 | 0.2281 | Yes | ||
| 3 | PSMB6 | 926 | 6.842 | 0.2940 | Yes | ||
| 4 | PSMB2 | 1066 | 6.195 | 0.3630 | Yes | ||
| 5 | PSMA4 | 1197 | 5.761 | 0.4271 | Yes | ||
| 6 | PSMD12 | 1419 | 4.991 | 0.4768 | Yes | ||
| 7 | PSMB5 | 1637 | 4.411 | 0.5196 | Yes | ||
| 8 | PSMA1 | 1655 | 4.376 | 0.5726 | Yes | ||
| 9 | PSMB3 | 1749 | 4.193 | 0.6194 | Yes | ||
| 10 | PSMC2 | 1868 | 3.906 | 0.6612 | Yes | ||
| 11 | PSMB4 | 2328 | 3.116 | 0.6750 | Yes | ||
| 12 | PSMA5 | 2658 | 2.718 | 0.6909 | Yes | ||
| 13 | PSMD13 | 2689 | 2.676 | 0.7223 | Yes | ||
| 14 | PSMD11 | 2983 | 2.403 | 0.7362 | Yes | ||
| 15 | PSMA2 | 3324 | 2.126 | 0.7441 | Yes | ||
| 16 | PSMC3 | 3404 | 2.066 | 0.7654 | Yes | ||
| 17 | PSMA3 | 3935 | 1.768 | 0.7587 | Yes | ||
| 18 | PSMB7 | 4120 | 1.681 | 0.7695 | Yes | ||
| 19 | PSMA6 | 7598 | 0.565 | 0.5896 | No | ||
| 20 | PSMB1 | 8935 | 0.231 | 0.5206 | No |