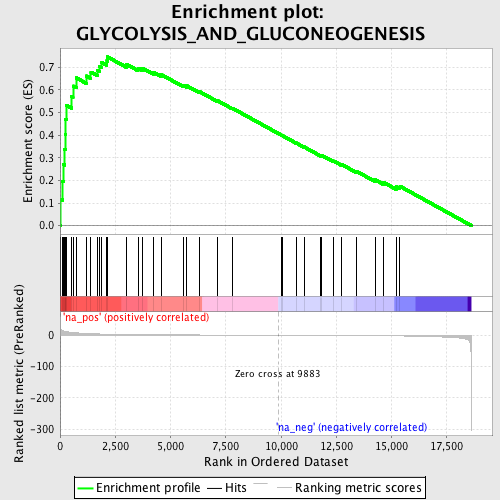
Profile of the Running ES Score & Positions of GeneSet Members on the Rank Ordered List
| Dataset | set04_DMpreB_versus_WTpreB |
| Phenotype | NoPhenotypeAvailable |
| Upregulated in class | na_pos |
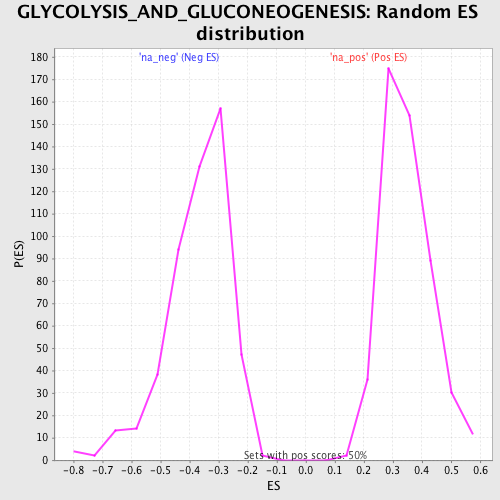
| GeneSet | GLYCOLYSIS_AND_GLUCONEOGENESIS |
| Enrichment Score (ES) | 0.7465297 |
| Normalized Enrichment Score (NES) | 2.1582007 |
| Nominal p-value | 0.0 |
| FDR q-value | 0.0 |
| FWER p-Value | 0.0 |
| PROBE | GENE SYMBOL | GENE_TITLE | RANK IN GENE LIST | RANK METRIC SCORE | RUNNING ES | CORE ENRICHMENT | |
|---|---|---|---|---|---|---|---|
| 1 | HK2 | 26 | 21.204 | 0.1173 | Yes | ||
| 2 | LDHA | 113 | 15.066 | 0.1970 | Yes | ||
| 3 | GOT2 | 160 | 13.524 | 0.2703 | Yes | ||
| 4 | TNFAIP1 | 208 | 12.558 | 0.3380 | Yes | ||
| 5 | GAPDH | 234 | 12.120 | 0.4045 | Yes | ||
| 6 | TPI1 | 251 | 11.903 | 0.4703 | Yes | ||
| 7 | PKM2 | 293 | 11.356 | 0.5317 | Yes | ||
| 8 | PFKP | 522 | 9.334 | 0.5716 | Yes | ||
| 9 | PFKM | 585 | 8.819 | 0.6177 | Yes | ||
| 10 | PGAM1 | 732 | 7.838 | 0.6537 | Yes | ||
| 11 | PGK1 | 1183 | 5.808 | 0.6620 | Yes | ||
| 12 | ENO1 | 1395 | 5.075 | 0.6790 | Yes | ||
| 13 | ENO3 | 1689 | 4.322 | 0.6875 | Yes | ||
| 14 | GOT1 | 1789 | 4.075 | 0.7049 | Yes | ||
| 15 | MDH2 | 1864 | 3.916 | 0.7229 | Yes | ||
| 16 | PFKL | 2119 | 3.459 | 0.7286 | Yes | ||
| 17 | DLD | 2142 | 3.420 | 0.7465 | Yes | ||
| 18 | DLAT | 2992 | 2.395 | 0.7142 | No | ||
| 19 | PGAM2 | 3527 | 1.991 | 0.6966 | No | ||
| 20 | PDHB | 3730 | 1.867 | 0.6962 | No | ||
| 21 | FBP2 | 4216 | 1.630 | 0.6792 | No | ||
| 22 | LDHAL6B | 4578 | 1.478 | 0.6681 | No | ||
| 23 | MDH1 | 5574 | 1.135 | 0.6209 | No | ||
| 24 | LDHC | 5734 | 1.085 | 0.6184 | No | ||
| 25 | PDHX | 6314 | 0.909 | 0.5923 | No | ||
| 26 | GCK | 7105 | 0.697 | 0.5537 | No | ||
| 27 | G6PC | 7794 | 0.514 | 0.5195 | No | ||
| 28 | HK1 | 10024 | -0.039 | 0.3998 | No | ||
| 29 | PCK1 | 10049 | -0.046 | 0.3987 | No | ||
| 30 | GAPDHS | 10682 | -0.204 | 0.3658 | No | ||
| 31 | ENO2 | 11040 | -0.300 | 0.3483 | No | ||
| 32 | HK3 | 11804 | -0.507 | 0.3101 | No | ||
| 33 | ALDOC | 11820 | -0.510 | 0.3121 | No | ||
| 34 | PKLR | 12376 | -0.675 | 0.2860 | No | ||
| 35 | FBP1 | 12719 | -0.784 | 0.2720 | No | ||
| 36 | PGK2 | 13404 | -1.019 | 0.2409 | No | ||
| 37 | ALDOA | 14258 | -1.395 | 0.2028 | No | ||
| 38 | PDHA2 | 14645 | -1.605 | 0.1910 | No | ||
| 39 | PDHA1 | 15210 | -1.954 | 0.1716 | No | ||
| 40 | ALDOB | 15382 | -2.094 | 0.1741 | No |