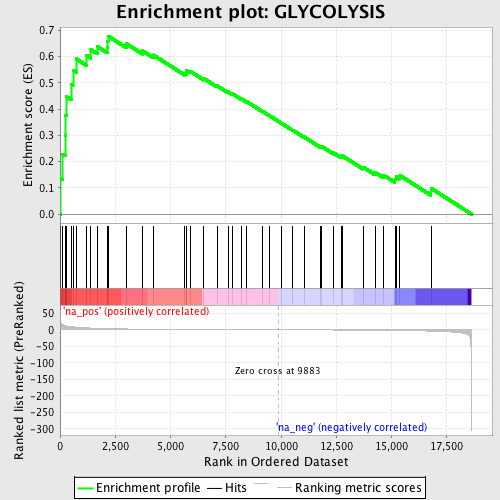
Profile of the Running ES Score & Positions of GeneSet Members on the Rank Ordered List
| Dataset | set04_DMpreB_versus_WTpreB |
| Phenotype | NoPhenotypeAvailable |
| Upregulated in class | na_pos |
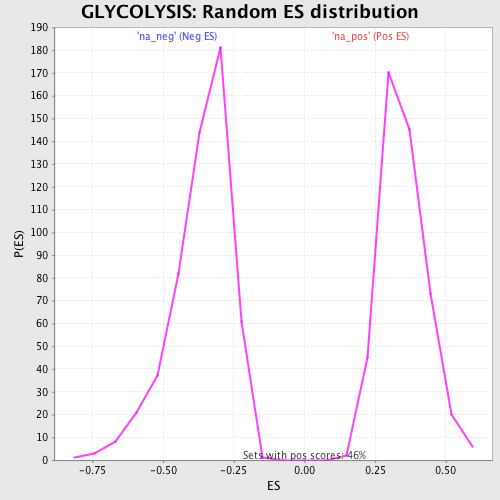
| GeneSet | GLYCOLYSIS |
| Enrichment Score (ES) | 0.67764986 |
| Normalized Enrichment Score (NES) | 1.9442855 |
| Nominal p-value | 0.0 |
| FDR q-value | 0.0010653777 |
| FWER p-Value | 0.018 |
| PROBE | GENE SYMBOL | GENE_TITLE | RANK IN GENE LIST | RANK METRIC SCORE | RUNNING ES | CORE ENRICHMENT | |
|---|---|---|---|---|---|---|---|
| 1 | HK2 | 26 | 21.204 | 0.1354 | Yes | ||
| 2 | LDHA | 113 | 15.066 | 0.2280 | Yes | ||
| 3 | GAPDH | 234 | 12.120 | 0.2998 | Yes | ||
| 4 | TPI1 | 251 | 11.903 | 0.3757 | Yes | ||
| 5 | PKM2 | 293 | 11.356 | 0.4468 | Yes | ||
| 6 | PFKP | 522 | 9.334 | 0.4948 | Yes | ||
| 7 | PFKM | 585 | 8.819 | 0.5484 | Yes | ||
| 8 | PGAM1 | 732 | 7.838 | 0.5911 | Yes | ||
| 9 | PGK1 | 1183 | 5.808 | 0.6043 | Yes | ||
| 10 | ENO1 | 1395 | 5.075 | 0.6257 | Yes | ||
| 11 | ENO3 | 1689 | 4.322 | 0.6378 | Yes | ||
| 12 | DLD | 2142 | 3.420 | 0.6356 | Yes | ||
| 13 | ALDH3B1 | 2162 | 3.388 | 0.6564 | Yes | ||
| 14 | PGM3 | 2173 | 3.373 | 0.6776 | Yes | ||
| 15 | DLAT | 2992 | 2.395 | 0.6491 | No | ||
| 16 | PDHB | 3730 | 1.867 | 0.6214 | No | ||
| 17 | FBP2 | 4216 | 1.630 | 0.6058 | No | ||
| 18 | ALDH1A3 | 5649 | 1.109 | 0.5359 | No | ||
| 19 | ADH4 | 5724 | 1.087 | 0.5389 | No | ||
| 20 | LDHC | 5734 | 1.085 | 0.5455 | No | ||
| 21 | ALDH2 | 5886 | 1.036 | 0.5440 | No | ||
| 22 | ADH1A | 6509 | 0.851 | 0.5160 | No | ||
| 23 | GCK | 7105 | 0.697 | 0.4885 | No | ||
| 24 | ALDH1A2 | 7606 | 0.563 | 0.4652 | No | ||
| 25 | G6PC | 7794 | 0.514 | 0.4584 | No | ||
| 26 | ALDH3A1 | 8214 | 0.408 | 0.4385 | No | ||
| 27 | ALDH1A1 | 8445 | 0.349 | 0.4284 | No | ||
| 28 | ADH7 | 9160 | 0.181 | 0.3911 | No | ||
| 29 | ALDH9A1 | 9473 | 0.097 | 0.3749 | No | ||
| 30 | HK1 | 10024 | -0.039 | 0.3456 | No | ||
| 31 | ACYP2 | 10516 | -0.158 | 0.3202 | No | ||
| 32 | ENO2 | 11040 | -0.300 | 0.2939 | No | ||
| 33 | HK3 | 11804 | -0.507 | 0.2561 | No | ||
| 34 | ALDOC | 11820 | -0.510 | 0.2586 | No | ||
| 35 | PKLR | 12376 | -0.675 | 0.2331 | No | ||
| 36 | FBP1 | 12719 | -0.784 | 0.2197 | No | ||
| 37 | BPGM | 12772 | -0.796 | 0.2221 | No | ||
| 38 | PGM1 | 13709 | -1.139 | 0.1790 | No | ||
| 39 | ALDOA | 14258 | -1.395 | 0.1585 | No | ||
| 40 | PDHA2 | 14645 | -1.605 | 0.1481 | No | ||
| 41 | ADHFE1 | 15157 | -1.917 | 0.1330 | No | ||
| 42 | PDHA1 | 15210 | -1.954 | 0.1428 | No | ||
| 43 | ALDOB | 15382 | -2.094 | 0.1471 | No | ||
| 44 | ALDH1B1 | 16786 | -4.183 | 0.0985 | No |