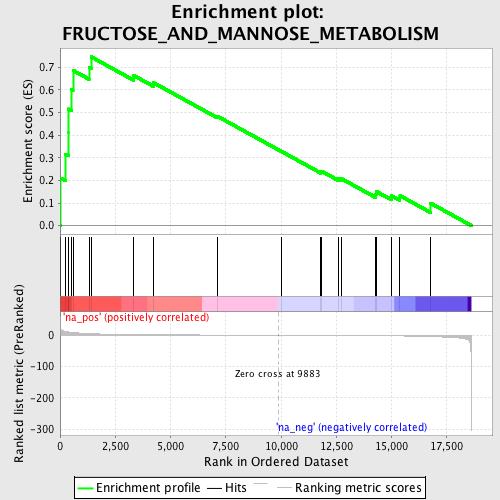
Profile of the Running ES Score & Positions of GeneSet Members on the Rank Ordered List
| Dataset | set04_DMpreB_versus_WTpreB |
| Phenotype | NoPhenotypeAvailable |
| Upregulated in class | na_pos |
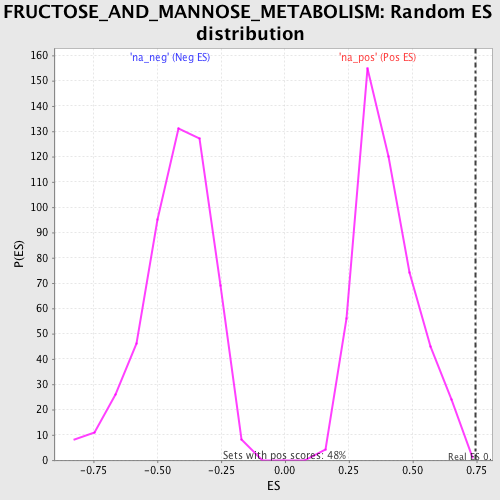
| GeneSet | FRUCTOSE_AND_MANNOSE_METABOLISM |
| Enrichment Score (ES) | 0.7464023 |
| Normalized Enrichment Score (NES) | 1.8699658 |
| Nominal p-value | 0.0020876827 |
| FDR q-value | 0.002946342 |
| FWER p-Value | 0.07 |
| PROBE | GENE SYMBOL | GENE_TITLE | RANK IN GENE LIST | RANK METRIC SCORE | RUNNING ES | CORE ENRICHMENT | |
|---|---|---|---|---|---|---|---|
| 1 | HK2 | 26 | 21.204 | 0.2099 | Yes | ||
| 2 | TPI1 | 251 | 11.903 | 0.3165 | Yes | ||
| 3 | GMDS | 388 | 10.391 | 0.4128 | Yes | ||
| 4 | PMM2 | 391 | 10.357 | 0.5159 | Yes | ||
| 5 | PFKP | 522 | 9.334 | 0.6019 | Yes | ||
| 6 | PFKM | 585 | 8.819 | 0.6865 | Yes | ||
| 7 | GMPPA | 1311 | 5.379 | 0.7011 | Yes | ||
| 8 | PMM1 | 1405 | 5.047 | 0.7464 | Yes | ||
| 9 | FPGT | 3337 | 2.118 | 0.6637 | No | ||
| 10 | FBP2 | 4216 | 1.630 | 0.6327 | No | ||
| 11 | GCK | 7105 | 0.697 | 0.4844 | No | ||
| 12 | HK1 | 10024 | -0.039 | 0.3278 | No | ||
| 13 | HK3 | 11804 | -0.507 | 0.2372 | No | ||
| 14 | ALDOC | 11820 | -0.510 | 0.2415 | No | ||
| 15 | GMPPB | 12602 | -0.745 | 0.2069 | No | ||
| 16 | FBP1 | 12719 | -0.784 | 0.2085 | No | ||
| 17 | ALDOA | 14258 | -1.395 | 0.1397 | No | ||
| 18 | PFKFB1 | 14318 | -1.431 | 0.1508 | No | ||
| 19 | KHK | 14996 | -1.808 | 0.1324 | No | ||
| 20 | ALDOB | 15382 | -2.094 | 0.1326 | No | ||
| 21 | PFKFB3 | 16773 | -4.143 | 0.0991 | No |