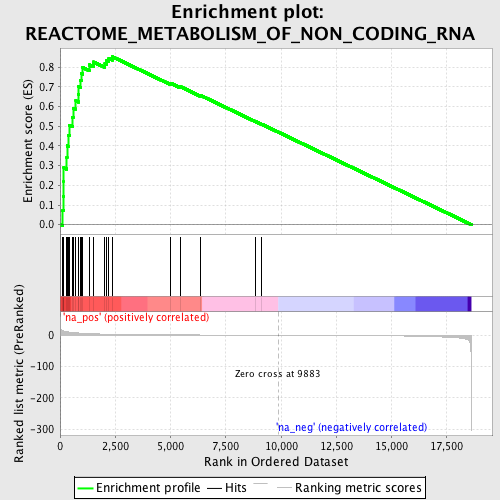
Profile of the Running ES Score & Positions of GeneSet Members on the Rank Ordered List
| Dataset | set04_DMpreB_versus_WTpreB |
| Phenotype | NoPhenotypeAvailable |
| Upregulated in class | na_pos |
| GeneSet | REACTOME_METABOLISM_OF_NON_CODING_RNA |
| Enrichment Score (ES) | 0.8526654 |
| Normalized Enrichment Score (NES) | 2.2497377 |
| Nominal p-value | 0.0 |
| FDR q-value | 0.0 |
| FWER p-Value | 0.0 |
| PROBE | GENE SYMBOL | GENE_TITLE | RANK IN GENE LIST | RANK METRIC SCORE | RUNNING ES | CORE ENRICHMENT | |
|---|---|---|---|---|---|---|---|
| 1 | NUP43 | 121 | 14.890 | 0.0737 | Yes | ||
| 2 | PRMT5 | 155 | 13.606 | 0.1451 | Yes | ||
| 3 | NUP93 | 164 | 13.456 | 0.2172 | Yes | ||
| 4 | NUPL2 | 170 | 13.284 | 0.2884 | Yes | ||
| 5 | RAE1 | 304 | 11.233 | 0.3417 | Yes | ||
| 6 | SNRPF | 315 | 11.120 | 0.4011 | Yes | ||
| 7 | SNRPD3 | 380 | 10.453 | 0.4539 | Yes | ||
| 8 | CLNS1A | 431 | 9.980 | 0.5050 | Yes | ||
| 9 | NUP37 | 557 | 9.038 | 0.5469 | Yes | ||
| 10 | NUP107 | 592 | 8.768 | 0.5923 | Yes | ||
| 11 | GEMIN4 | 714 | 7.991 | 0.6288 | Yes | ||
| 12 | SNRPG | 825 | 7.378 | 0.6626 | Yes | ||
| 13 | SNRPD2 | 844 | 7.271 | 0.7008 | Yes | ||
| 14 | NCBP2 | 918 | 6.876 | 0.7339 | Yes | ||
| 15 | NUP155 | 964 | 6.666 | 0.7673 | Yes | ||
| 16 | NUP54 | 1023 | 6.376 | 0.7986 | Yes | ||
| 17 | SNUPN | 1316 | 5.357 | 0.8117 | Yes | ||
| 18 | SNRPB | 1510 | 4.709 | 0.8267 | Yes | ||
| 19 | NUP62 | 2028 | 3.620 | 0.8183 | Yes | ||
| 20 | SIP1 | 2108 | 3.481 | 0.8328 | Yes | ||
| 21 | RANBP2 | 2207 | 3.299 | 0.8453 | Yes | ||
| 22 | NUP160 | 2376 | 3.042 | 0.8527 | Yes | ||
| 23 | NUP35 | 5008 | 1.322 | 0.7183 | No | ||
| 24 | TPR | 5446 | 1.175 | 0.7011 | No | ||
| 25 | SNRPE | 6369 | 0.891 | 0.6563 | No | ||
| 26 | NUP188 | 8829 | 0.258 | 0.5254 | No | ||
| 27 | NUP153 | 9114 | 0.191 | 0.5111 | No |