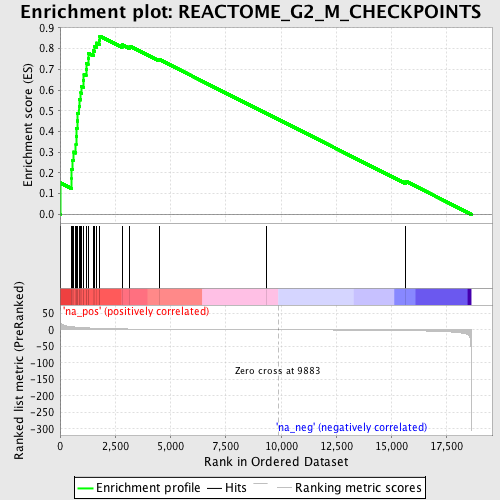
Profile of the Running ES Score & Positions of GeneSet Members on the Rank Ordered List
| Dataset | set04_DMpreB_versus_WTpreB |
| Phenotype | NoPhenotypeAvailable |
| Upregulated in class | na_pos |
| GeneSet | REACTOME_G2_M_CHECKPOINTS |
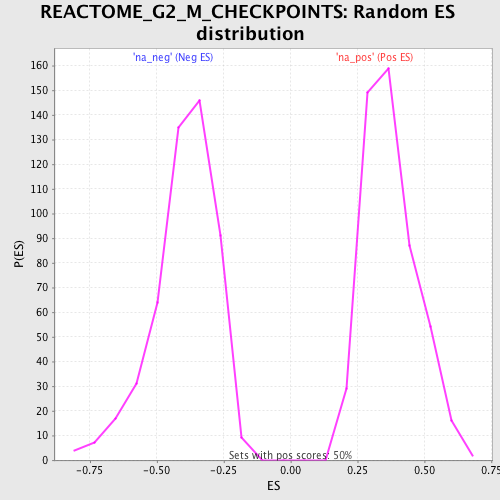
| Enrichment Score (ES) | 0.860234 |
| Normalized Enrichment Score (NES) | 2.3063743 |
| Nominal p-value | 0.0 |
| FDR q-value | 0.0 |
| FWER p-Value | 0.0 |
| PROBE | GENE SYMBOL | GENE_TITLE | RANK IN GENE LIST | RANK METRIC SCORE | RUNNING ES | CORE ENRICHMENT | |
|---|---|---|---|---|---|---|---|
| 1 | MCM6 | 9 | 30.323 | 0.1521 | Yes | ||
| 2 | ORC1L | 524 | 9.323 | 0.1714 | Yes | ||
| 3 | RPA2 | 529 | 9.268 | 0.2178 | Yes | ||
| 4 | RFC5 | 570 | 8.951 | 0.2607 | Yes | ||
| 5 | MCM7 | 624 | 8.576 | 0.3011 | Yes | ||
| 6 | RFC4 | 717 | 7.960 | 0.3362 | Yes | ||
| 7 | ORC2L | 724 | 7.897 | 0.3756 | Yes | ||
| 8 | RPA1 | 738 | 7.796 | 0.4141 | Yes | ||
| 9 | RFC3 | 771 | 7.657 | 0.4509 | Yes | ||
| 10 | MCM3 | 785 | 7.561 | 0.4883 | Yes | ||
| 11 | ORC5L | 854 | 7.204 | 0.5209 | Yes | ||
| 12 | RAD9B | 877 | 7.056 | 0.5552 | Yes | ||
| 13 | MCM10 | 940 | 6.780 | 0.5860 | Yes | ||
| 14 | CDC25A | 963 | 6.668 | 0.6184 | Yes | ||
| 15 | MCM4 | 1059 | 6.251 | 0.6447 | Yes | ||
| 16 | CHEK1 | 1080 | 6.140 | 0.6746 | Yes | ||
| 17 | CDC45L | 1175 | 5.835 | 0.6989 | Yes | ||
| 18 | MCM5 | 1196 | 5.762 | 0.7268 | Yes | ||
| 19 | MCM2 | 1266 | 5.511 | 0.7508 | Yes | ||
| 20 | ATM | 1279 | 5.474 | 0.7777 | Yes | ||
| 21 | HUS1 | 1505 | 4.725 | 0.7894 | Yes | ||
| 22 | CDC7 | 1547 | 4.625 | 0.8105 | Yes | ||
| 23 | RPA3 | 1650 | 4.387 | 0.8271 | Yes | ||
| 24 | RAD1 | 1786 | 4.078 | 0.8403 | Yes | ||
| 25 | CDK2 | 1797 | 4.060 | 0.8602 | Yes | ||
| 26 | CCNB1 | 2806 | 2.558 | 0.8189 | No | ||
| 27 | WEE1 | 3159 | 2.243 | 0.8112 | No | ||
| 28 | CDC25C | 4477 | 1.518 | 0.7480 | No | ||
| 29 | CCNB2 | 9319 | 0.141 | 0.4883 | No | ||
| 30 | ORC4L | 15649 | -2.357 | 0.1596 | No |