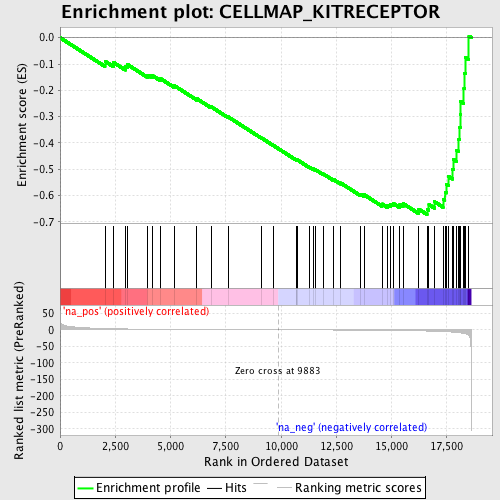
Profile of the Running ES Score & Positions of GeneSet Members on the Rank Ordered List
| Dataset | set04_DMpreB_versus_WTpreB |
| Phenotype | NoPhenotypeAvailable |
| Upregulated in class | na_neg |
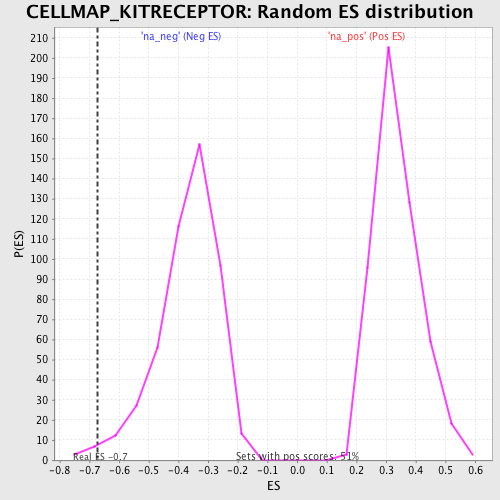
| GeneSet | CELLMAP_KITRECEPTOR |
| Enrichment Score (ES) | -0.67191696 |
| Normalized Enrichment Score (NES) | -1.8128877 |
| Nominal p-value | 0.018442623 |
| FDR q-value | 0.38144323 |
| FWER p-Value | 0.992 |
| PROBE | GENE SYMBOL | GENE_TITLE | RANK IN GENE LIST | RANK METRIC SCORE | RUNNING ES | CORE ENRICHMENT | |
|---|---|---|---|---|---|---|---|
| 1 | CRK | 2032 | 3.614 | -0.0897 | No | ||
| 2 | PTPN11 | 2411 | 3.002 | -0.0937 | No | ||
| 3 | AKT1 | 2954 | 2.432 | -0.1096 | No | ||
| 4 | CLTC | 3052 | 2.341 | -0.1021 | No | ||
| 5 | SRC | 3975 | 1.750 | -0.1422 | No | ||
| 6 | SHC1 | 4178 | 1.653 | -0.1441 | No | ||
| 7 | KHDRBS1 | 4542 | 1.493 | -0.1555 | No | ||
| 8 | SPRED2 | 5163 | 1.267 | -0.1819 | No | ||
| 9 | HRAS | 6193 | 0.946 | -0.2322 | No | ||
| 10 | STAT5B | 6838 | 0.764 | -0.2627 | No | ||
| 11 | PIK3R2 | 7604 | 0.563 | -0.3008 | No | ||
| 12 | SPRED1 | 9122 | 0.189 | -0.3815 | No | ||
| 13 | KIT | 9643 | 0.063 | -0.4092 | No | ||
| 14 | RPS6KA1 | 10686 | -0.204 | -0.4642 | No | ||
| 15 | LYN | 10706 | -0.211 | -0.4641 | No | ||
| 16 | GRB7 | 10735 | -0.219 | -0.4644 | No | ||
| 17 | PLCE1 | 11299 | -0.374 | -0.4926 | No | ||
| 18 | YES1 | 11451 | -0.412 | -0.4985 | No | ||
| 19 | SOCS6 | 11559 | -0.442 | -0.5019 | No | ||
| 20 | STAT5A | 11913 | -0.538 | -0.5180 | No | ||
| 21 | MITF | 12381 | -0.676 | -0.5394 | No | ||
| 22 | SOS1 | 12695 | -0.778 | -0.5520 | No | ||
| 23 | PLCG1 | 13591 | -1.102 | -0.5942 | No | ||
| 24 | CBL | 13764 | -1.164 | -0.5971 | No | ||
| 25 | EPOR | 14570 | -1.563 | -0.6320 | No | ||
| 26 | KITLG | 14821 | -1.697 | -0.6362 | No | ||
| 27 | RASA1 | 14954 | -1.781 | -0.6336 | No | ||
| 28 | ABL1 | 15068 | -1.862 | -0.6295 | No | ||
| 29 | FYN | 15378 | -2.088 | -0.6347 | No | ||
| 30 | GRAP | 15524 | -2.234 | -0.6304 | No | ||
| 31 | RAF1 | 16233 | -3.067 | -0.6518 | Yes | ||
| 32 | BAD | 16608 | -3.779 | -0.6513 | Yes | ||
| 33 | CRKL | 16694 | -3.936 | -0.6344 | Yes | ||
| 34 | FGR | 16942 | -4.506 | -0.6231 | Yes | ||
| 35 | MATK | 17333 | -5.562 | -0.6138 | Yes | ||
| 36 | DOK1 | 17420 | -5.829 | -0.5866 | Yes | ||
| 37 | GRB2 | 17489 | -6.003 | -0.5576 | Yes | ||
| 38 | JAK2 | 17579 | -6.349 | -0.5277 | Yes | ||
| 39 | HCK | 17757 | -6.940 | -0.4994 | Yes | ||
| 40 | FES | 17794 | -7.117 | -0.4625 | Yes | ||
| 41 | CBLB | 17953 | -7.957 | -0.4276 | Yes | ||
| 42 | SH3KBP1 | 18046 | -8.546 | -0.3860 | Yes | ||
| 43 | SOCS5 | 18091 | -8.885 | -0.3399 | Yes | ||
| 44 | PRKCA | 18108 | -9.028 | -0.2915 | Yes | ||
| 45 | SOCS1 | 18119 | -9.137 | -0.2422 | Yes | ||
| 46 | STAT1 | 18276 | -10.570 | -0.1929 | Yes | ||
| 47 | VAV1 | 18300 | -10.774 | -0.1354 | Yes | ||
| 48 | PIK3CG | 18341 | -11.438 | -0.0752 | Yes | ||
| 49 | PTPN6 | 18504 | -16.488 | 0.0060 | Yes |