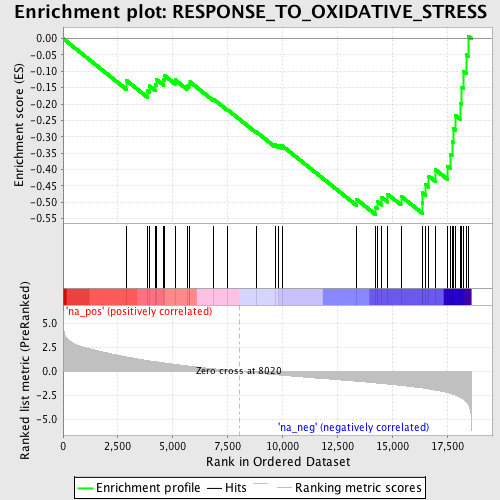
Profile of the Running ES Score & Positions of GeneSet Members on the Rank Ordered List
| Dataset | set03_wtNotch_versus_truncNotch |
| Phenotype | NoPhenotypeAvailable |
| Upregulated in class | na_neg |
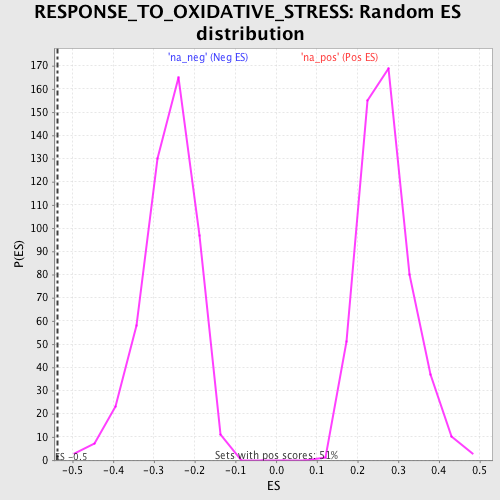
| GeneSet | RESPONSE_TO_OXIDATIVE_STRESS |
| Enrichment Score (ES) | -0.537425 |
| Normalized Enrichment Score (NES) | -2.036726 |
| Nominal p-value | 0.0 |
| FDR q-value | 0.050206013 |
| FWER p-Value | 0.111 |
| PROBE | GENE SYMBOL | GENE_TITLE | RANK IN GENE LIST | RANK METRIC SCORE | RUNNING ES | CORE ENRICHMENT | |
|---|---|---|---|---|---|---|---|
| 1 | CYGB | 2885 | 1.503 | -0.1279 | No | ||
| 2 | APOA4 | 3860 | 1.118 | -0.1599 | No | ||
| 3 | ERCC3 | 3940 | 1.088 | -0.1444 | No | ||
| 4 | NDUFB4 | 4216 | 0.998 | -0.1410 | No | ||
| 5 | GCLC | 4249 | 0.987 | -0.1248 | No | ||
| 6 | SRXN1 | 4574 | 0.880 | -0.1262 | No | ||
| 7 | PRNP | 4618 | 0.865 | -0.1127 | No | ||
| 8 | GCLM | 5107 | 0.721 | -0.1259 | No | ||
| 9 | NDUFA6 | 5648 | 0.567 | -0.1446 | No | ||
| 10 | SOD2 | 5738 | 0.540 | -0.1395 | No | ||
| 11 | RNF7 | 5782 | 0.528 | -0.1322 | No | ||
| 12 | SGK2 | 6860 | 0.264 | -0.1854 | No | ||
| 13 | SEPP1 | 7503 | 0.115 | -0.2178 | No | ||
| 14 | ATOX1 | 8792 | -0.161 | -0.2842 | No | ||
| 15 | SOD1 | 9660 | -0.352 | -0.3245 | No | ||
| 16 | GLRX2 | 9807 | -0.381 | -0.3254 | No | ||
| 17 | NUDT1 | 9984 | -0.412 | -0.3274 | No | ||
| 18 | PRDX2 | 13373 | -1.033 | -0.4909 | No | ||
| 19 | MPO | 14238 | -1.204 | -0.5155 | Yes | ||
| 20 | DHCR24 | 14317 | -1.224 | -0.4974 | Yes | ||
| 21 | CCL5 | 14526 | -1.272 | -0.4854 | Yes | ||
| 22 | APTX | 14787 | -1.323 | -0.4753 | Yes | ||
| 23 | TXNRD2 | 15401 | -1.465 | -0.4816 | Yes | ||
| 24 | NDUFS2 | 16368 | -1.733 | -0.5020 | Yes | ||
| 25 | PRDX5 | 16389 | -1.741 | -0.4714 | Yes | ||
| 26 | MSRA | 16519 | -1.788 | -0.4457 | Yes | ||
| 27 | NDUFS8 | 16670 | -1.845 | -0.4202 | Yes | ||
| 28 | GSS | 16973 | -1.966 | -0.4007 | Yes | ||
| 29 | SCARA3 | 17527 | -2.232 | -0.3898 | Yes | ||
| 30 | GPX3 | 17654 | -2.306 | -0.3545 | Yes | ||
| 31 | ERCC2 | 17727 | -2.361 | -0.3154 | Yes | ||
| 32 | PNKP | 17777 | -2.401 | -0.2743 | Yes | ||
| 33 | ERCC1 | 17895 | -2.491 | -0.2352 | Yes | ||
| 34 | PRDX6 | 18102 | -2.713 | -0.1969 | Yes | ||
| 35 | PDLIM1 | 18174 | -2.796 | -0.1498 | Yes | ||
| 36 | STK25 | 18250 | -2.926 | -0.1005 | Yes | ||
| 37 | DUSP1 | 18382 | -3.185 | -0.0495 | Yes | ||
| 38 | ERCC8 | 18474 | -3.406 | 0.0076 | Yes |