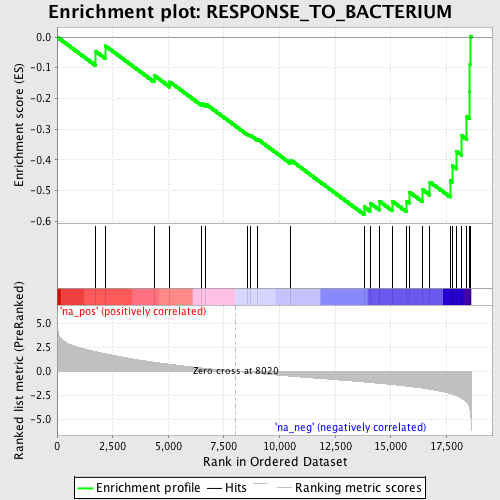
Profile of the Running ES Score & Positions of GeneSet Members on the Rank Ordered List
| Dataset | set03_wtNotch_versus_truncNotch |
| Phenotype | NoPhenotypeAvailable |
| Upregulated in class | na_neg |
| GeneSet | RESPONSE_TO_BACTERIUM |
| Enrichment Score (ES) | -0.5783717 |
| Normalized Enrichment Score (NES) | -1.9605385 |
| Nominal p-value | 0.0 |
| FDR q-value | 0.09544336 |
| FWER p-Value | 0.284 |
| PROBE | GENE SYMBOL | GENE_TITLE | RANK IN GENE LIST | RANK METRIC SCORE | RUNNING ES | CORE ENRICHMENT | |
|---|---|---|---|---|---|---|---|
| 1 | IL12A | 1731 | 2.059 | -0.0465 | No | ||
| 2 | NOD2 | 2179 | 1.826 | -0.0292 | No | ||
| 3 | TLR3 | 4362 | 0.950 | -0.1250 | No | ||
| 4 | BCL10 | 5071 | 0.732 | -0.1465 | No | ||
| 5 | NLRC4 | 6497 | 0.350 | -0.2153 | No | ||
| 6 | CD24 | 6690 | 0.305 | -0.2187 | No | ||
| 7 | SPACA3 | 8562 | -0.118 | -0.3166 | No | ||
| 8 | PGLYRP3 | 8700 | -0.144 | -0.3207 | No | ||
| 9 | CHIT1 | 9018 | -0.213 | -0.3330 | No | ||
| 10 | DEFB103A | 10512 | -0.511 | -0.4017 | No | ||
| 11 | PGLYRP1 | 13797 | -1.112 | -0.5532 | Yes | ||
| 12 | CFP | 14064 | -1.165 | -0.5411 | Yes | ||
| 13 | STAB1 | 14488 | -1.262 | -0.5353 | Yes | ||
| 14 | LALBA | 15066 | -1.387 | -0.5349 | Yes | ||
| 15 | TLR6 | 15714 | -1.545 | -0.5347 | Yes | ||
| 16 | CAMP | 15832 | -1.582 | -0.5052 | Yes | ||
| 17 | DMBT1 | 16433 | -1.756 | -0.4977 | Yes | ||
| 18 | WFDC12 | 16757 | -1.878 | -0.4725 | Yes | ||
| 19 | DEFB127 | 17666 | -2.319 | -0.4689 | Yes | ||
| 20 | STAB2 | 17754 | -2.381 | -0.4196 | Yes | ||
| 21 | PGLYRP4 | 17951 | -2.545 | -0.3725 | Yes | ||
| 22 | SLC11A1 | 18182 | -2.808 | -0.3213 | Yes | ||
| 23 | IL10 | 18421 | -3.274 | -0.2600 | Yes | ||
| 24 | PGLYRP2 | 18549 | -3.916 | -0.1781 | Yes | ||
| 25 | SPN | 18555 | -3.979 | -0.0883 | Yes | ||
| 26 | NOD1 | 18561 | -4.040 | 0.0030 | Yes |