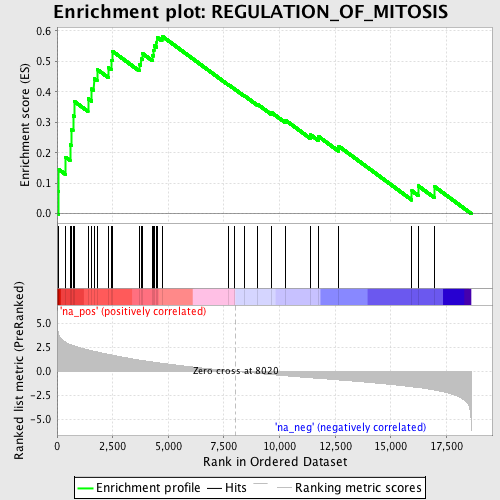
Profile of the Running ES Score & Positions of GeneSet Members on the Rank Ordered List
| Dataset | set03_wtNotch_versus_truncNotch |
| Phenotype | NoPhenotypeAvailable |
| Upregulated in class | na_pos |
| GeneSet | REGULATION_OF_MITOSIS |
| Enrichment Score (ES) | 0.58263934 |
| Normalized Enrichment Score (NES) | 2.184774 |
| Nominal p-value | 0.0 |
| FDR q-value | 0.0030195604 |
| FWER p-Value | 0.019 |
| PROBE | GENE SYMBOL | GENE_TITLE | RANK IN GENE LIST | RANK METRIC SCORE | RUNNING ES | CORE ENRICHMENT | |
|---|---|---|---|---|---|---|---|
| 1 | TGFA | 49 | 4.065 | 0.0737 | Yes | ||
| 2 | ANLN | 70 | 3.873 | 0.1453 | Yes | ||
| 3 | CCNA2 | 386 | 3.023 | 0.1851 | Yes | ||
| 4 | EGF | 585 | 2.793 | 0.2269 | Yes | ||
| 5 | NUSAP1 | 636 | 2.749 | 0.2758 | Yes | ||
| 6 | MAD2L1 | 718 | 2.685 | 0.3219 | Yes | ||
| 7 | BUB1B | 774 | 2.637 | 0.3684 | Yes | ||
| 8 | NBN | 1390 | 2.246 | 0.3775 | Yes | ||
| 9 | RAD17 | 1551 | 2.152 | 0.4093 | Yes | ||
| 10 | CHFR | 1658 | 2.095 | 0.4429 | Yes | ||
| 11 | ZW10 | 1798 | 2.028 | 0.4735 | Yes | ||
| 12 | CDC25C | 2318 | 1.762 | 0.4787 | Yes | ||
| 13 | ZWINT | 2444 | 1.700 | 0.5039 | Yes | ||
| 14 | PIN1 | 2489 | 1.683 | 0.5331 | Yes | ||
| 15 | PCBP4 | 3690 | 1.177 | 0.4906 | Yes | ||
| 16 | KNTC1 | 3770 | 1.150 | 0.5079 | Yes | ||
| 17 | CDC16 | 3837 | 1.128 | 0.5256 | Yes | ||
| 18 | EPGN | 4280 | 0.975 | 0.5201 | Yes | ||
| 19 | TTK | 4334 | 0.959 | 0.5352 | Yes | ||
| 20 | NPM2 | 4359 | 0.950 | 0.5518 | Yes | ||
| 21 | BIRC5 | 4482 | 0.913 | 0.5623 | Yes | ||
| 22 | ATM | 4489 | 0.911 | 0.5791 | Yes | ||
| 23 | CDC23 | 4716 | 0.834 | 0.5826 | Yes | ||
| 24 | EREG | 7714 | 0.073 | 0.4227 | No | ||
| 25 | UBE2C | 7954 | 0.017 | 0.4102 | No | ||
| 26 | BUB1 | 8427 | -0.087 | 0.3864 | No | ||
| 27 | RCC1 | 8994 | -0.206 | 0.3598 | No | ||
| 28 | PRMT5 | 9642 | -0.349 | 0.3316 | No | ||
| 29 | TGFB1 | 10258 | -0.463 | 0.3072 | No | ||
| 30 | CD28 | 11391 | -0.675 | 0.2589 | No | ||
| 31 | CDKN2B | 11760 | -0.733 | 0.2529 | No | ||
| 32 | NEK6 | 12660 | -0.899 | 0.2214 | No | ||
| 33 | NEK2 | 15945 | -1.615 | 0.0750 | No | ||
| 34 | MAD2L2 | 16232 | -1.691 | 0.0913 | No | ||
| 35 | PML | 16972 | -1.966 | 0.0885 | No |
