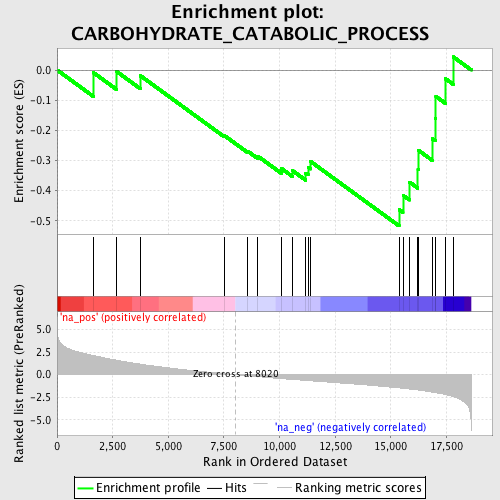
Profile of the Running ES Score & Positions of GeneSet Members on the Rank Ordered List
| Dataset | set03_wtNotch_versus_truncNotch |
| Phenotype | NoPhenotypeAvailable |
| Upregulated in class | na_neg |
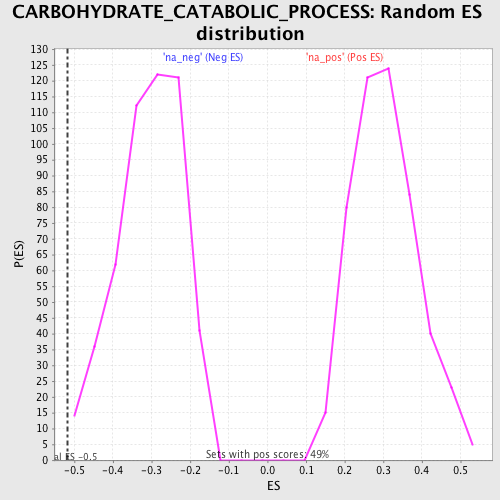
| GeneSet | CARBOHYDRATE_CATABOLIC_PROCESS |
| Enrichment Score (ES) | -0.5171684 |
| Normalized Enrichment Score (NES) | -1.6864187 |
| Nominal p-value | 0.003937008 |
| FDR q-value | 0.32146874 |
| FWER p-Value | 0.995 |
| PROBE | GENE SYMBOL | GENE_TITLE | RANK IN GENE LIST | RANK METRIC SCORE | RUNNING ES | CORE ENRICHMENT | |
|---|---|---|---|---|---|---|---|
| 1 | MGAM | 1637 | 2.109 | -0.0089 | No | ||
| 2 | PFKM | 2680 | 1.592 | -0.0052 | No | ||
| 3 | PGLS | 3749 | 1.158 | -0.0191 | No | ||
| 4 | GBA2 | 7502 | 0.116 | -0.2165 | No | ||
| 5 | SPACA3 | 8562 | -0.118 | -0.2690 | No | ||
| 6 | CHIT1 | 9018 | -0.213 | -0.2855 | No | ||
| 7 | ALDOB | 10089 | -0.431 | -0.3269 | No | ||
| 8 | HK1 | 10572 | -0.523 | -0.3332 | No | ||
| 9 | TREH | 11176 | -0.638 | -0.3417 | No | ||
| 10 | MIOX | 11285 | -0.659 | -0.3228 | No | ||
| 11 | GNS | 11388 | -0.675 | -0.3029 | No | ||
| 12 | TKTL1 | 15373 | -1.456 | -0.4625 | Yes | ||
| 13 | HYAL4 | 15548 | -1.504 | -0.4154 | Yes | ||
| 14 | PYGB | 15841 | -1.584 | -0.3717 | Yes | ||
| 15 | PGD | 16220 | -1.686 | -0.3287 | Yes | ||
| 16 | GAA | 16233 | -1.691 | -0.2659 | Yes | ||
| 17 | GAPDHS | 16860 | -1.921 | -0.2274 | Yes | ||
| 18 | PFKL | 16997 | -1.976 | -0.1606 | Yes | ||
| 19 | GNPDA1 | 17025 | -1.985 | -0.0876 | Yes | ||
| 20 | PFKFB1 | 17451 | -2.183 | -0.0285 | Yes | ||
| 21 | ALDOA | 17804 | -2.426 | 0.0437 | Yes |