Profile of the Running ES Score & Positions of GeneSet Members on the Rank Ordered List
| Dataset | set03_wtNotch_versus_normalThy |
| Phenotype | NoPhenotypeAvailable |
| Upregulated in class | na_pos |
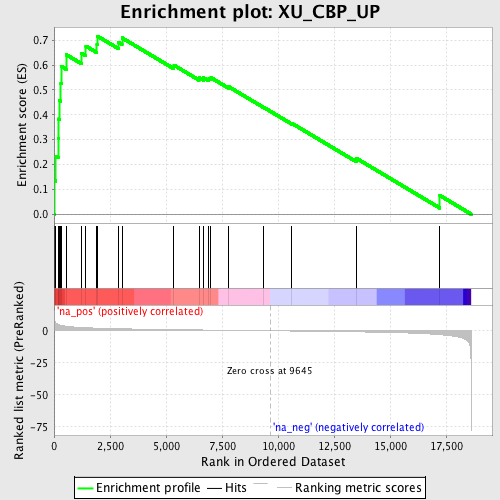
| GeneSet | XU_CBP_UP |
| Enrichment Score (ES) | 0.7163599 |
| Normalized Enrichment Score (NES) | 2.2252836 |
| Nominal p-value | 0.0 |
| FDR q-value | 2.9248654E-4 |
| FWER p-Value | 0.0030 |
| PROBE | GENE SYMBOL | GENE_TITLE | RANK IN GENE LIST | RANK METRIC SCORE | RUNNING ES | CORE ENRICHMENT | |
|---|---|---|---|---|---|---|---|
| 1 | PRMT1 | 25 | 8.190 | 0.1353 | Yes | ||
| 2 | PPAN | 82 | 5.990 | 0.2322 | Yes | ||
| 3 | HMOX1 | 192 | 4.771 | 0.3060 | Yes | ||
| 4 | GNL3 | 212 | 4.671 | 0.3829 | Yes | ||
| 5 | TSTA3 | 249 | 4.507 | 0.4561 | Yes | ||
| 6 | ADSL | 303 | 4.299 | 0.5250 | Yes | ||
| 7 | 2600005C20RIK | 324 | 4.230 | 0.5945 | Yes | ||
| 8 | ALG3 | 553 | 3.530 | 0.6412 | Yes | ||
| 9 | NVL | 1210 | 2.546 | 0.6484 | Yes | ||
| 10 | KTN1 | 1420 | 2.342 | 0.6762 | Yes | ||
| 11 | XPOT | 1912 | 2.036 | 0.6838 | Yes | ||
| 12 | LGMN | 1933 | 2.019 | 0.7164 | Yes | ||
| 13 | LRG1 | 2883 | 1.584 | 0.6918 | No | ||
| 14 | NME4 | 3033 | 1.530 | 0.7093 | No | ||
| 15 | MELA | 5349 | 0.877 | 0.5994 | No | ||
| 16 | RCN1 | 6469 | 0.634 | 0.5498 | No | ||
| 17 | RAD1 | 6670 | 0.595 | 0.5490 | No | ||
| 18 | S100A6 | 6911 | 0.546 | 0.5452 | No | ||
| 19 | 9830147J24RIK | 7001 | 0.529 | 0.5492 | No | ||
| 20 | MCM2 | 7792 | 0.369 | 0.5129 | No | ||
| 21 | LRRN1 | 9350 | 0.060 | 0.4301 | No | ||
| 22 | PROM1 | 10613 | -0.195 | 0.3655 | No | ||
| 23 | CTLA2B | 13494 | -0.847 | 0.2247 | No | ||
| 24 | 8430420C20RIK | 17221 | -3.038 | 0.0750 | No |
