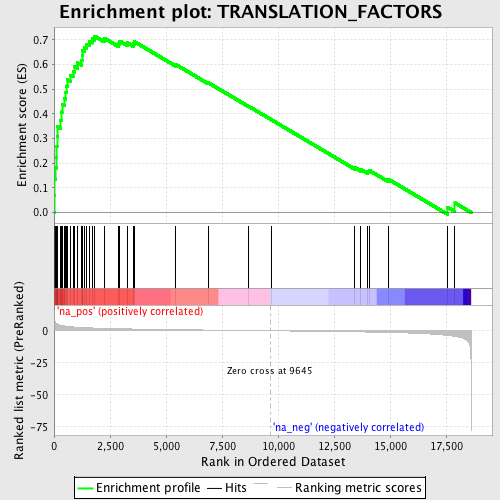
Profile of the Running ES Score & Positions of GeneSet Members on the Rank Ordered List
| Dataset | set03_wtNotch_versus_normalThy |
| Phenotype | NoPhenotypeAvailable |
| Upregulated in class | na_pos |
| GeneSet | TRANSLATION_FACTORS |
| Enrichment Score (ES) | 0.71470875 |
| Normalized Enrichment Score (NES) | 2.5091734 |
| Nominal p-value | 0.0 |
| FDR q-value | 0.0 |
| FWER p-Value | 0.0 |

| PROBE | GENE SYMBOL | GENE_TITLE | RANK IN GENE LIST | RANK METRIC SCORE | RUNNING ES | CORE ENRICHMENT | |
|---|---|---|---|---|---|---|---|
| 1 | EIF5A | 17 | 8.994 | 0.0706 | Yes | ||
| 2 | EIF2B5 | 23 | 8.347 | 0.1367 | Yes | ||
| 3 | EIF3S2 | 76 | 6.098 | 0.1824 | Yes | ||
| 4 | EIF2B3 | 116 | 5.490 | 0.2240 | Yes | ||
| 5 | EIF4EBP1 | 123 | 5.427 | 0.2668 | Yes | ||
| 6 | EIF3S4 | 133 | 5.299 | 0.3084 | Yes | ||
| 7 | EIF3S6 | 157 | 5.085 | 0.3476 | Yes | ||
| 8 | EIF3S9 | 292 | 4.318 | 0.3748 | Yes | ||
| 9 | EEF1D | 316 | 4.254 | 0.4073 | Yes | ||
| 10 | EIF2S2 | 356 | 4.088 | 0.4378 | Yes | ||
| 11 | EIF3S7 | 471 | 3.726 | 0.4613 | Yes | ||
| 12 | EIF2S1 | 521 | 3.595 | 0.4872 | Yes | ||
| 13 | EIF4E | 566 | 3.497 | 0.5126 | Yes | ||
| 14 | EEF1G | 603 | 3.399 | 0.5377 | Yes | ||
| 15 | EIF2B1 | 728 | 3.118 | 0.5559 | Yes | ||
| 16 | EEF2 | 849 | 2.935 | 0.5727 | Yes | ||
| 17 | PABPC1 | 920 | 2.833 | 0.5915 | Yes | ||
| 18 | EIF3S3 | 1048 | 2.704 | 0.6062 | Yes | ||
| 19 | ETF1 | 1215 | 2.540 | 0.6174 | Yes | ||
| 20 | EIF3S10 | 1250 | 2.506 | 0.6355 | Yes | ||
| 21 | ITGB4BP | 1258 | 2.495 | 0.6550 | Yes | ||
| 22 | EIF2AK2 | 1341 | 2.409 | 0.6697 | Yes | ||
| 23 | EEF2K | 1461 | 2.311 | 0.6817 | Yes | ||
| 24 | EIF4A1 | 1577 | 2.235 | 0.6933 | Yes | ||
| 25 | EIF4A2 | 1698 | 2.160 | 0.7040 | Yes | ||
| 26 | EIF3S8 | 1809 | 2.093 | 0.7147 | Yes | ||
| 27 | EEF1B2 | 2251 | 1.860 | 0.7058 | No | ||
| 28 | EIF1AY | 2884 | 1.584 | 0.6843 | No | ||
| 29 | EIF2B4 | 2921 | 1.568 | 0.6949 | No | ||
| 30 | EEF1A2 | 3264 | 1.445 | 0.6879 | No | ||
| 31 | EIF2B2 | 3550 | 1.349 | 0.6833 | No | ||
| 32 | EIF4G1 | 3577 | 1.342 | 0.6926 | No | ||
| 33 | PAIP1 | 5422 | 0.860 | 0.6001 | No | ||
| 34 | EIF4G3 | 6875 | 0.553 | 0.5264 | No | ||
| 35 | SLC35A4 | 8678 | 0.188 | 0.4308 | No | ||
| 36 | EIF5 | 9700 | -0.012 | 0.3760 | No | ||
| 37 | EIF5B | 13429 | -0.831 | 0.1819 | No | ||
| 38 | GSPT2 | 13694 | -0.897 | 0.1748 | No | ||
| 39 | EIF2AK1 | 13989 | -0.984 | 0.1668 | No | ||
| 40 | EIF3S1 | 14058 | -1.000 | 0.1711 | No | ||
| 41 | EIF3S5 | 14934 | -1.289 | 0.1342 | No | ||
| 42 | EIF2AK3 | 17575 | -3.644 | 0.0211 | No | ||
| 43 | EIF4EBP2 | 17895 | -4.393 | 0.0388 | No |
