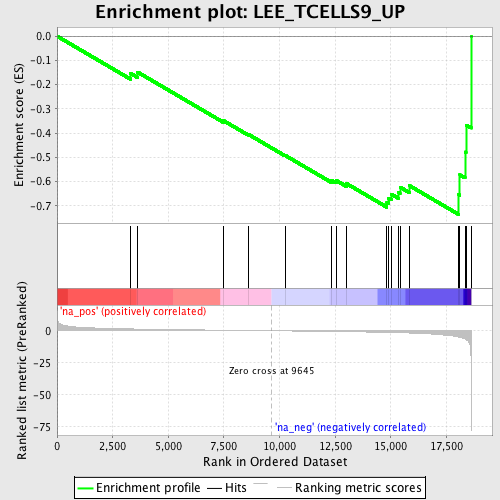
Profile of the Running ES Score & Positions of GeneSet Members on the Rank Ordered List
| Dataset | set03_wtNotch_versus_normalThy |
| Phenotype | NoPhenotypeAvailable |
| Upregulated in class | na_neg |
| GeneSet | LEE_TCELLS9_UP |
| Enrichment Score (ES) | -0.73600614 |
| Normalized Enrichment Score (NES) | -1.9313953 |
| Nominal p-value | 0.0016806723 |
| FDR q-value | 0.11103077 |
| FWER p-Value | 0.783 |
| PROBE | GENE SYMBOL | GENE_TITLE | RANK IN GENE LIST | RANK METRIC SCORE | RUNNING ES | CORE ENRICHMENT | |
|---|---|---|---|---|---|---|---|
| 1 | TOP2A | 3305 | 1.430 | -0.1538 | No | ||
| 2 | SPRY2 | 3611 | 1.332 | -0.1479 | No | ||
| 3 | CCR9 | 7472 | 0.430 | -0.3483 | No | ||
| 4 | TIMP2 | 8588 | 0.207 | -0.4047 | No | ||
| 5 | LZTFL1 | 10252 | -0.121 | -0.4921 | No | ||
| 6 | HTR2B | 12332 | -0.562 | -0.5945 | No | ||
| 7 | MARCKS | 12541 | -0.614 | -0.5954 | No | ||
| 8 | NR4A2 | 13020 | -0.725 | -0.6090 | No | ||
| 9 | RSAD2 | 14822 | -1.245 | -0.6850 | Yes | ||
| 10 | P2RY1 | 14907 | -1.277 | -0.6682 | Yes | ||
| 11 | DSG2 | 15026 | -1.330 | -0.6523 | Yes | ||
| 12 | TYMS | 15352 | -1.475 | -0.6451 | Yes | ||
| 13 | SOX4 | 15416 | -1.508 | -0.6233 | Yes | ||
| 14 | BCOR | 15828 | -1.731 | -0.6164 | Yes | ||
| 15 | CCNG2 | 18053 | -4.860 | -0.6547 | Yes | ||
| 16 | SPRED2 | 18104 | -5.067 | -0.5727 | Yes | ||
| 17 | TOX | 18338 | -6.406 | -0.4780 | Yes | ||
| 18 | PDE4D | 18382 | -6.789 | -0.3668 | Yes | ||
| 19 | EGR2 | 18610 | -22.681 | 0.0003 | Yes |
