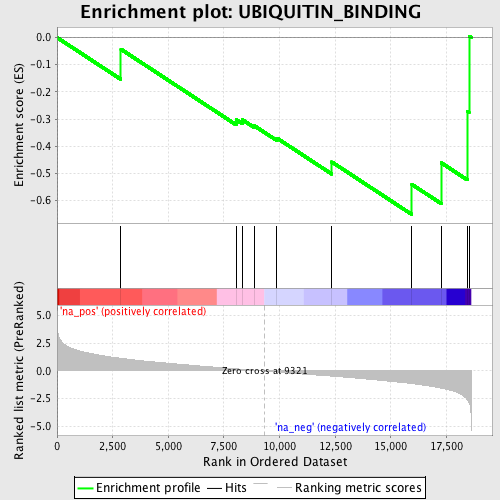
Profile of the Running ES Score & Positions of GeneSet Members on the Rank Ordered List
| Dataset | set03_wtNotch_versus_absentNotch |
| Phenotype | NoPhenotypeAvailable |
| Upregulated in class | na_neg |
| GeneSet | UBIQUITIN_BINDING |
| Enrichment Score (ES) | -0.6512199 |
| Normalized Enrichment Score (NES) | -1.722055 |
| Nominal p-value | 0.006122449 |
| FDR q-value | 0.4213972 |
| FWER p-Value | 0.978 |
| PROBE | GENE SYMBOL | GENE_TITLE | RANK IN GENE LIST | RANK METRIC SCORE | RUNNING ES | CORE ENRICHMENT | |
|---|---|---|---|---|---|---|---|
| 1 | UBE2N | 2869 | 1.144 | -0.0430 | No | ||
| 2 | SIRT2 | 8054 | 0.195 | -0.3026 | No | ||
| 3 | BCL10 | 8333 | 0.153 | -0.3027 | No | ||
| 4 | TOP2A | 8857 | 0.068 | -0.3242 | No | ||
| 5 | TSG101 | 9878 | -0.094 | -0.3699 | No | ||
| 6 | SQSTM1 | 12347 | -0.459 | -0.4579 | No | ||
| 7 | NUP62 | 15945 | -1.140 | -0.5404 | Yes | ||
| 8 | TOM1L1 | 17267 | -1.547 | -0.4610 | Yes | ||
| 9 | CIITA | 18445 | -2.601 | -0.2715 | Yes | ||
| 10 | UCHL1 | 18518 | -2.887 | 0.0053 | Yes |
