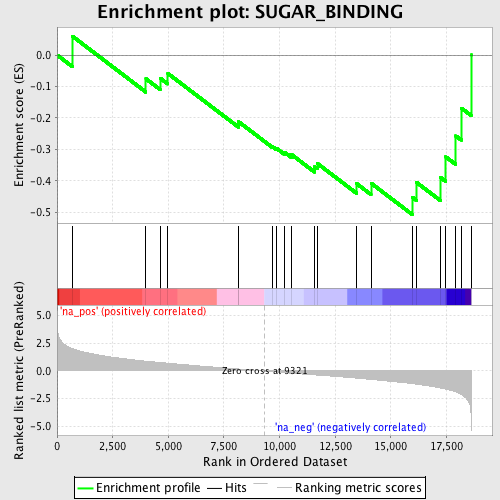
Profile of the Running ES Score & Positions of GeneSet Members on the Rank Ordered List
| Dataset | set03_wtNotch_versus_absentNotch |
| Phenotype | NoPhenotypeAvailable |
| Upregulated in class | na_neg |
| GeneSet | SUGAR_BINDING |
| Enrichment Score (ES) | -0.50674933 |
| Normalized Enrichment Score (NES) | -1.6221493 |
| Nominal p-value | 0.01713062 |
| FDR q-value | 0.48423663 |
| FWER p-Value | 1.0 |
| PROBE | GENE SYMBOL | GENE_TITLE | RANK IN GENE LIST | RANK METRIC SCORE | RUNNING ES | CORE ENRICHMENT | |
|---|---|---|---|---|---|---|---|
| 1 | ACR | 682 | 2.017 | 0.0601 | No | ||
| 2 | LGALS12 | 3993 | 0.881 | -0.0756 | No | ||
| 3 | LGALS4 | 4632 | 0.760 | -0.0735 | No | ||
| 4 | LGALS7 | 4979 | 0.698 | -0.0586 | No | ||
| 5 | GCK | 8153 | 0.182 | -0.2205 | No | ||
| 6 | KLRA1 | 8162 | 0.181 | -0.2123 | No | ||
| 7 | KLRG1 | 9665 | -0.055 | -0.2904 | No | ||
| 8 | CD207 | 9864 | -0.092 | -0.2966 | No | ||
| 9 | REG3A | 10239 | -0.149 | -0.3096 | No | ||
| 10 | LGALS8 | 10538 | -0.192 | -0.3164 | No | ||
| 11 | PRG2 | 11572 | -0.346 | -0.3554 | No | ||
| 12 | LMAN2L | 11696 | -0.364 | -0.3445 | No | ||
| 13 | GALK1 | 13468 | -0.642 | -0.4090 | No | ||
| 14 | MRC1 | 14111 | -0.756 | -0.4073 | No | ||
| 15 | CLEC4E | 15962 | -1.145 | -0.4518 | Yes | ||
| 16 | POLA1 | 16164 | -1.194 | -0.4053 | Yes | ||
| 17 | LMAN1 | 17242 | -1.534 | -0.3897 | Yes | ||
| 18 | SFTPD | 17473 | -1.631 | -0.3238 | Yes | ||
| 19 | LGALS9 | 17923 | -1.891 | -0.2572 | Yes | ||
| 20 | LGALS3 | 18168 | -2.122 | -0.1685 | Yes | ||
| 21 | CLEC7A | 18612 | -4.013 | 0.0002 | Yes |
