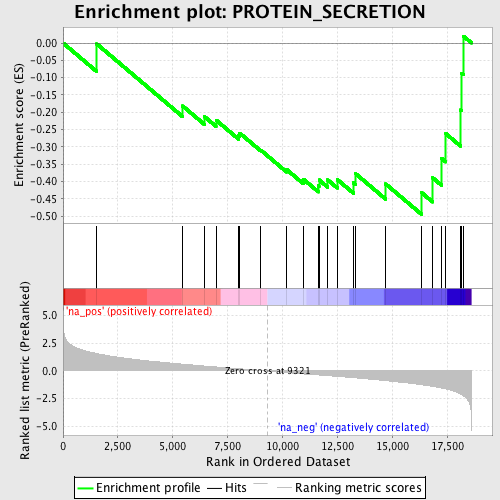
Profile of the Running ES Score & Positions of GeneSet Members on the Rank Ordered List
| Dataset | set03_wtNotch_versus_absentNotch |
| Phenotype | NoPhenotypeAvailable |
| Upregulated in class | na_neg |
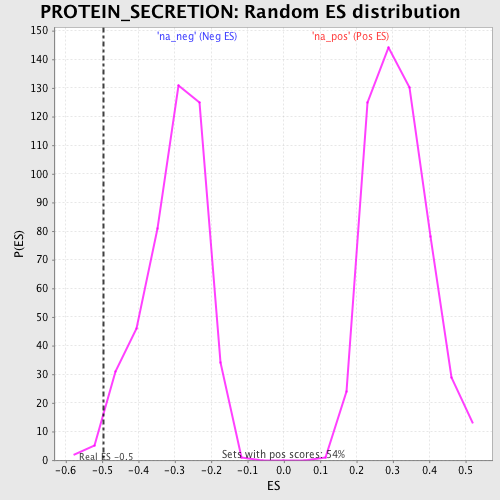
| GeneSet | PROTEIN_SECRETION |
| Enrichment Score (ES) | -0.4953643 |
| Normalized Enrichment Score (NES) | -1.642182 |
| Nominal p-value | 0.010964912 |
| FDR q-value | 0.4669125 |
| FWER p-Value | 1.0 |
| PROBE | GENE SYMBOL | GENE_TITLE | RANK IN GENE LIST | RANK METRIC SCORE | RUNNING ES | CORE ENRICHMENT | |
|---|---|---|---|---|---|---|---|
| 1 | NOD2 | 1536 | 1.581 | -0.0026 | No | ||
| 2 | CRTAM | 5446 | 0.614 | -0.1817 | No | ||
| 3 | APOA2 | 6433 | 0.448 | -0.2121 | No | ||
| 4 | ARFGAP3 | 6971 | 0.362 | -0.2226 | No | ||
| 5 | DNAJC1 | 8005 | 0.204 | -0.2679 | No | ||
| 6 | SCG2 | 8044 | 0.197 | -0.2599 | No | ||
| 7 | NLRC4 | 9004 | 0.048 | -0.3091 | No | ||
| 8 | ARL4D | 10190 | -0.142 | -0.3656 | No | ||
| 9 | CIDEA | 10945 | -0.260 | -0.3930 | No | ||
| 10 | PPY | 11641 | -0.356 | -0.4124 | No | ||
| 11 | APOA1 | 11666 | -0.360 | -0.3955 | No | ||
| 12 | ABCA1 | 12059 | -0.419 | -0.3954 | No | ||
| 13 | CADM1 | 12500 | -0.483 | -0.3946 | No | ||
| 14 | LTBP2 | 13239 | -0.601 | -0.4039 | No | ||
| 15 | ARFIP1 | 13336 | -0.619 | -0.3777 | No | ||
| 16 | GLMN | 14701 | -0.869 | -0.4071 | No | ||
| 17 | ACHE | 16344 | -1.242 | -0.4325 | Yes | ||
| 18 | FOXP3 | 16844 | -1.383 | -0.3894 | Yes | ||
| 19 | NLRP2 | 17250 | -1.536 | -0.3334 | Yes | ||
| 20 | NLRP3 | 17443 | -1.621 | -0.2617 | Yes | ||
| 21 | PYCARD | 18117 | -2.066 | -0.1933 | Yes | ||
| 22 | BACE2 | 18170 | -2.129 | -0.0884 | Yes | ||
| 23 | CANX | 18244 | -2.219 | 0.0200 | Yes |