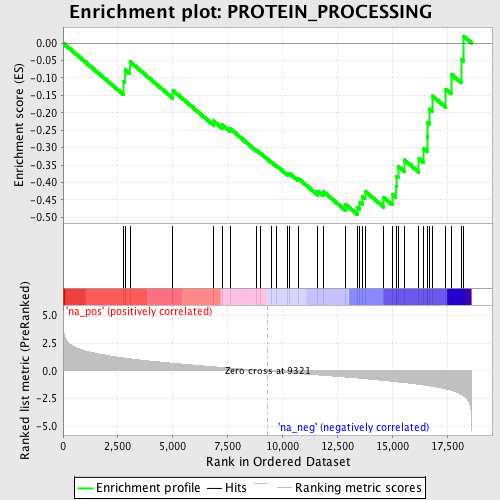
Profile of the Running ES Score & Positions of GeneSet Members on the Rank Ordered List
| Dataset | set03_wtNotch_versus_absentNotch |
| Phenotype | NoPhenotypeAvailable |
| Upregulated in class | na_neg |
| GeneSet | PROTEIN_PROCESSING |
| Enrichment Score (ES) | -0.49158087 |
| Normalized Enrichment Score (NES) | -1.8831999 |
| Nominal p-value | 0.0 |
| FDR q-value | 0.22132689 |
| FWER p-Value | 0.577 |
| PROBE | GENE SYMBOL | GENE_TITLE | RANK IN GENE LIST | RANK METRIC SCORE | RUNNING ES | CORE ENRICHMENT | |
|---|---|---|---|---|---|---|---|
| 1 | CUZD1 | 2754 | 1.175 | -0.1103 | No | ||
| 2 | CDKL5 | 2820 | 1.156 | -0.0765 | No | ||
| 3 | APH1A | 3048 | 1.098 | -0.0533 | No | ||
| 4 | PCSK5 | 5007 | 0.694 | -0.1363 | No | ||
| 5 | PSEN2 | 6855 | 0.381 | -0.2234 | No | ||
| 6 | EIF2AK3 | 7249 | 0.318 | -0.2343 | No | ||
| 7 | MAP3K11 | 7608 | 0.261 | -0.2452 | No | ||
| 8 | PTCH1 | 8816 | 0.075 | -0.3077 | No | ||
| 9 | AKT1 | 9010 | 0.047 | -0.3166 | No | ||
| 10 | ECE2 | 9507 | -0.028 | -0.3424 | No | ||
| 11 | MAP3K9 | 9734 | -0.068 | -0.3523 | No | ||
| 12 | MAP3K3 | 10229 | -0.147 | -0.3742 | No | ||
| 13 | PPP2R5C | 10314 | -0.158 | -0.3736 | No | ||
| 14 | DYRK1A | 10713 | -0.219 | -0.3879 | No | ||
| 15 | PCSK9 | 11605 | -0.351 | -0.4246 | No | ||
| 16 | TNK1 | 11857 | -0.389 | -0.4255 | No | ||
| 17 | MAP3K12 | 12853 | -0.540 | -0.4617 | No | ||
| 18 | FURIN | 13410 | -0.633 | -0.4712 | Yes | ||
| 19 | MIPEP | 13528 | -0.655 | -0.4563 | Yes | ||
| 20 | PAK2 | 13640 | -0.672 | -0.4406 | Yes | ||
| 21 | CRKRS | 13760 | -0.694 | -0.4246 | Yes | ||
| 22 | LMTK2 | 14619 | -0.853 | -0.4433 | Yes | ||
| 23 | PSEN1 | 15009 | -0.936 | -0.4340 | Yes | ||
| 24 | CAMKK2 | 15172 | -0.966 | -0.4116 | Yes | ||
| 25 | STK4 | 15191 | -0.969 | -0.3813 | Yes | ||
| 26 | TTN | 15268 | -0.984 | -0.3536 | Yes | ||
| 27 | PAK1 | 15552 | -1.046 | -0.3350 | Yes | ||
| 28 | INSR | 16218 | -1.206 | -0.3319 | Yes | ||
| 29 | MYO3A | 16409 | -1.257 | -0.3016 | Yes | ||
| 30 | MAP3K10 | 16590 | -1.307 | -0.2691 | Yes | ||
| 31 | NCSTN | 16606 | -1.311 | -0.2276 | Yes | ||
| 32 | MAP3K13 | 16696 | -1.341 | -0.1891 | Yes | ||
| 33 | EIF2AK1 | 16829 | -1.380 | -0.1516 | Yes | ||
| 34 | SCG5 | 17445 | -1.622 | -0.1324 | Yes | ||
| 35 | IGF1R | 17685 | -1.733 | -0.0893 | Yes | ||
| 36 | METAP2 | 18143 | -2.096 | -0.0463 | Yes | ||
| 37 | UHMK1 | 18247 | -2.221 | 0.0199 | Yes |
