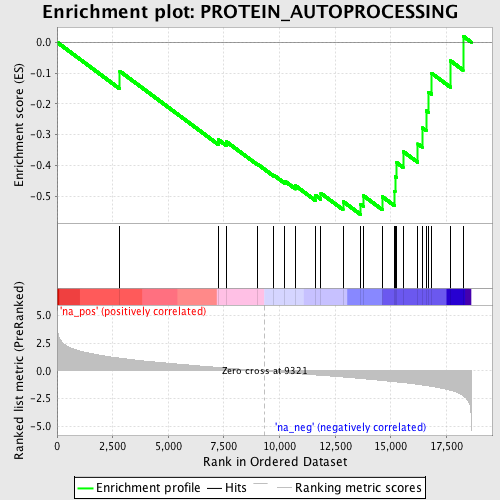
Profile of the Running ES Score & Positions of GeneSet Members on the Rank Ordered List
| Dataset | set03_wtNotch_versus_absentNotch |
| Phenotype | NoPhenotypeAvailable |
| Upregulated in class | na_neg |
| GeneSet | PROTEIN_AUTOPROCESSING |
| Enrichment Score (ES) | -0.55942017 |
| Normalized Enrichment Score (NES) | -1.8696034 |
| Nominal p-value | 0.0 |
| FDR q-value | 0.17023733 |
| FWER p-Value | 0.639 |
| PROBE | GENE SYMBOL | GENE_TITLE | RANK IN GENE LIST | RANK METRIC SCORE | RUNNING ES | CORE ENRICHMENT | |
|---|---|---|---|---|---|---|---|
| 1 | CDKL5 | 2820 | 1.156 | -0.0942 | No | ||
| 2 | EIF2AK3 | 7249 | 0.318 | -0.3166 | No | ||
| 3 | MAP3K11 | 7608 | 0.261 | -0.3229 | No | ||
| 4 | AKT1 | 9010 | 0.047 | -0.3959 | No | ||
| 5 | MAP3K9 | 9734 | -0.068 | -0.4314 | No | ||
| 6 | MAP3K3 | 10229 | -0.147 | -0.4507 | No | ||
| 7 | DYRK1A | 10713 | -0.219 | -0.4658 | No | ||
| 8 | PCSK9 | 11605 | -0.351 | -0.4963 | No | ||
| 9 | TNK1 | 11857 | -0.389 | -0.4905 | No | ||
| 10 | MAP3K12 | 12853 | -0.540 | -0.5171 | No | ||
| 11 | PAK2 | 13640 | -0.672 | -0.5260 | Yes | ||
| 12 | CRKRS | 13760 | -0.694 | -0.4979 | Yes | ||
| 13 | LMTK2 | 14619 | -0.853 | -0.5017 | Yes | ||
| 14 | CAMKK2 | 15172 | -0.966 | -0.4834 | Yes | ||
| 15 | STK4 | 15191 | -0.969 | -0.4362 | Yes | ||
| 16 | TTN | 15268 | -0.984 | -0.3914 | Yes | ||
| 17 | PAK1 | 15552 | -1.046 | -0.3546 | Yes | ||
| 18 | INSR | 16218 | -1.206 | -0.3304 | Yes | ||
| 19 | MYO3A | 16409 | -1.257 | -0.2782 | Yes | ||
| 20 | MAP3K10 | 16590 | -1.307 | -0.2230 | Yes | ||
| 21 | MAP3K13 | 16696 | -1.341 | -0.1619 | Yes | ||
| 22 | EIF2AK1 | 16829 | -1.380 | -0.1005 | Yes | ||
| 23 | IGF1R | 17685 | -1.733 | -0.0603 | Yes | ||
| 24 | UHMK1 | 18247 | -2.221 | 0.0198 | Yes |
