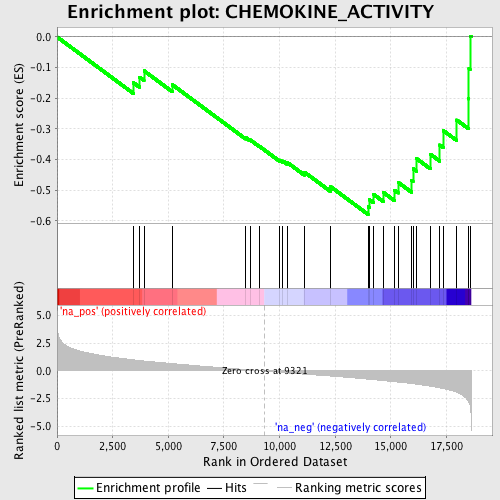
Profile of the Running ES Score & Positions of GeneSet Members on the Rank Ordered List
| Dataset | set03_wtNotch_versus_absentNotch |
| Phenotype | NoPhenotypeAvailable |
| Upregulated in class | na_neg |
| GeneSet | CHEMOKINE_ACTIVITY |
| Enrichment Score (ES) | -0.57950777 |
| Normalized Enrichment Score (NES) | -1.9759085 |
| Nominal p-value | 0.0 |
| FDR q-value | 0.15998366 |
| FWER p-Value | 0.262 |
| PROBE | GENE SYMBOL | GENE_TITLE | RANK IN GENE LIST | RANK METRIC SCORE | RUNNING ES | CORE ENRICHMENT | |
|---|---|---|---|---|---|---|---|
| 1 | CCL27 | 3429 | 1.007 | -0.1493 | No | ||
| 2 | CCL25 | 3699 | 0.945 | -0.1308 | No | ||
| 3 | CCL22 | 3908 | 0.899 | -0.1106 | No | ||
| 4 | CXCL1 | 5176 | 0.662 | -0.1556 | No | ||
| 5 | CCL19 | 8477 | 0.130 | -0.3286 | No | ||
| 6 | CCL11 | 8680 | 0.096 | -0.3361 | No | ||
| 7 | CXCL10 | 9077 | 0.037 | -0.3561 | No | ||
| 8 | XCL1 | 9997 | -0.114 | -0.4016 | No | ||
| 9 | CXCL2 | 10145 | -0.134 | -0.4048 | No | ||
| 10 | CCL1 | 10358 | -0.166 | -0.4104 | No | ||
| 11 | CXCL13 | 11111 | -0.285 | -0.4409 | No | ||
| 12 | CXCL11 | 12280 | -0.450 | -0.4881 | No | ||
| 13 | CXCL12 | 13981 | -0.731 | -0.5540 | Yes | ||
| 14 | CCL8 | 14044 | -0.742 | -0.5314 | Yes | ||
| 15 | CCL24 | 14222 | -0.776 | -0.5138 | Yes | ||
| 16 | CCL2 | 14662 | -0.862 | -0.5073 | Yes | ||
| 17 | CCL28 | 15163 | -0.964 | -0.5006 | Yes | ||
| 18 | PF4 | 15329 | -0.999 | -0.4746 | Yes | ||
| 19 | CCL3 | 15932 | -1.138 | -0.4672 | Yes | ||
| 20 | CX3CL1 | 16001 | -1.156 | -0.4305 | Yes | ||
| 21 | CCL4 | 16162 | -1.194 | -0.3975 | Yes | ||
| 22 | CCL7 | 16786 | -1.368 | -0.3832 | Yes | ||
| 23 | CXCL5 | 17203 | -1.519 | -0.3526 | Yes | ||
| 24 | CXCL14 | 17354 | -1.585 | -0.3053 | Yes | ||
| 25 | CXCL9 | 17960 | -1.915 | -0.2710 | Yes | ||
| 26 | CCL5 | 18500 | -2.806 | -0.2020 | Yes | ||
| 27 | CXCL16 | 18510 | -2.856 | -0.1028 | Yes | ||
| 28 | CCL17 | 18564 | -3.107 | 0.0028 | Yes |
