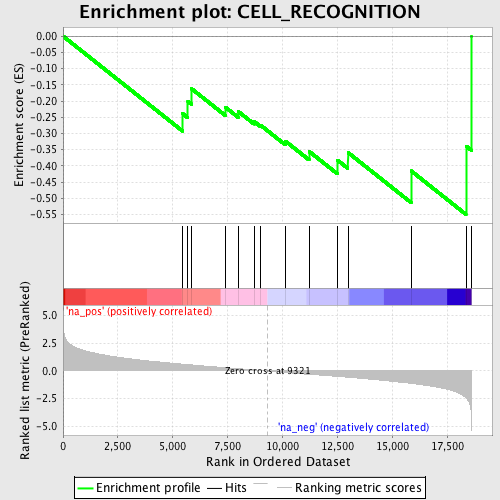
Profile of the Running ES Score & Positions of GeneSet Members on the Rank Ordered List
| Dataset | set03_wtNotch_versus_absentNotch |
| Phenotype | NoPhenotypeAvailable |
| Upregulated in class | na_neg |
| GeneSet | CELL_RECOGNITION |
| Enrichment Score (ES) | -0.54981726 |
| Normalized Enrichment Score (NES) | -1.6229293 |
| Nominal p-value | 0.019067796 |
| FDR q-value | 0.50826705 |
| FWER p-Value | 1.0 |
| PROBE | GENE SYMBOL | GENE_TITLE | RANK IN GENE LIST | RANK METRIC SCORE | RUNNING ES | CORE ENRICHMENT | |
|---|---|---|---|---|---|---|---|
| 1 | CRTAM | 5446 | 0.614 | -0.2388 | No | ||
| 2 | ZP2 | 5687 | 0.575 | -0.2013 | No | ||
| 3 | COLEC12 | 5848 | 0.550 | -0.1616 | No | ||
| 4 | CDK5R1 | 7391 | 0.294 | -0.2187 | No | ||
| 5 | SPAM1 | 7980 | 0.208 | -0.2320 | No | ||
| 6 | AMIGO1 | 8704 | 0.091 | -0.2629 | No | ||
| 7 | HNT | 9000 | 0.048 | -0.2745 | No | ||
| 8 | SLIT2 | 10132 | -0.132 | -0.3237 | No | ||
| 9 | PCDH12 | 11213 | -0.301 | -0.3553 | No | ||
| 10 | CADM1 | 12500 | -0.483 | -0.3821 | No | ||
| 11 | CNTN4 | 12984 | -0.562 | -0.3587 | No | ||
| 12 | VCAN | 15863 | -1.117 | -0.4154 | Yes | ||
| 13 | PECAM1 | 18365 | -2.403 | -0.3389 | Yes | ||
| 14 | CLEC7A | 18612 | -4.013 | 0.0002 | Yes |
