Profile of the Running ES Score & Positions of GeneSet Members on the Rank Ordered List
| Dataset | set03_wtNotch_versus_absentNotch |
| Phenotype | NoPhenotypeAvailable |
| Upregulated in class | na_neg |
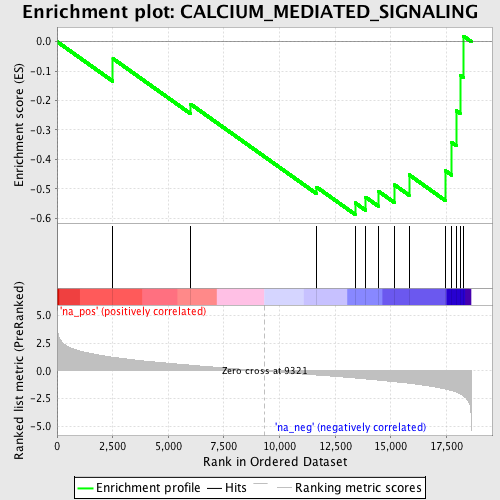
| GeneSet | CALCIUM_MEDIATED_SIGNALING |
| Enrichment Score (ES) | -0.58699465 |
| Normalized Enrichment Score (NES) | -1.6810149 |
| Nominal p-value | 0.017167382 |
| FDR q-value | 0.45042363 |
| FWER p-Value | 0.995 |
| PROBE | GENE SYMBOL | GENE_TITLE | RANK IN GENE LIST | RANK METRIC SCORE | RUNNING ES | CORE ENRICHMENT | |
|---|---|---|---|---|---|---|---|
| 1 | SPHK1 | 2511 | 1.237 | -0.0574 | No | ||
| 2 | LAT | 5998 | 0.523 | -0.2120 | No | ||
| 3 | PIP5K3 | 11668 | -0.361 | -0.4942 | No | ||
| 4 | PLCE1 | 13396 | -0.629 | -0.5476 | Yes | ||
| 5 | EGFR | 13862 | -0.712 | -0.5279 | Yes | ||
| 6 | NMUR2 | 14435 | -0.816 | -0.5075 | Yes | ||
| 7 | CAMKK2 | 15172 | -0.966 | -0.4866 | Yes | ||
| 8 | NMUR1 | 15822 | -1.105 | -0.4522 | Yes | ||
| 9 | RGN | 17453 | -1.623 | -0.4381 | Yes | ||
| 10 | LAT2 | 17739 | -1.768 | -0.3426 | Yes | ||
| 11 | CDH13 | 17941 | -1.902 | -0.2342 | Yes | ||
| 12 | BTK | 18115 | -2.064 | -0.1141 | Yes | ||
| 13 | NUDT4 | 18265 | -2.250 | 0.0189 | Yes |
