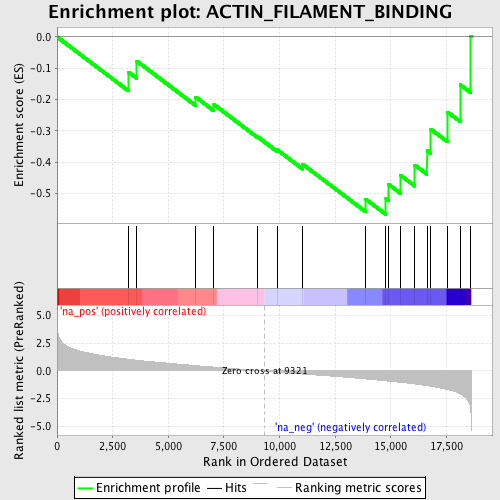
Profile of the Running ES Score & Positions of GeneSet Members on the Rank Ordered List
| Dataset | set03_wtNotch_versus_absentNotch |
| Phenotype | NoPhenotypeAvailable |
| Upregulated in class | na_neg |
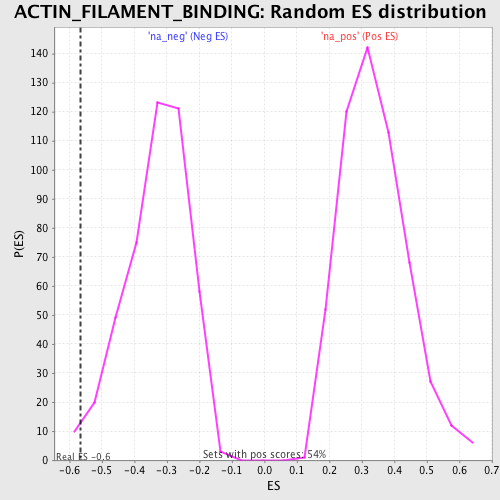
| GeneSet | ACTIN_FILAMENT_BINDING |
| Enrichment Score (ES) | -0.5669357 |
| Normalized Enrichment Score (NES) | -1.6999192 |
| Nominal p-value | 0.013071896 |
| FDR q-value | 0.42134318 |
| FWER p-Value | 0.989 |
| PROBE | GENE SYMBOL | GENE_TITLE | RANK IN GENE LIST | RANK METRIC SCORE | RUNNING ES | CORE ENRICHMENT | |
|---|---|---|---|---|---|---|---|
| 1 | MYH9 | 3204 | 1.059 | -0.1120 | No | ||
| 2 | NEXN | 3581 | 0.970 | -0.0770 | No | ||
| 3 | MARCKS | 6237 | 0.483 | -0.1922 | No | ||
| 4 | MAP1S | 7047 | 0.351 | -0.2157 | No | ||
| 5 | SCIN | 9019 | 0.045 | -0.3191 | No | ||
| 6 | MYH10 | 9894 | -0.098 | -0.3605 | No | ||
| 7 | ARPC4 | 11036 | -0.274 | -0.4063 | No | ||
| 8 | EGFR | 13862 | -0.712 | -0.5176 | Yes | ||
| 9 | UXT | 14780 | -0.887 | -0.5164 | Yes | ||
| 10 | MYO6 | 14897 | -0.911 | -0.4708 | Yes | ||
| 11 | ESPN | 15449 | -1.024 | -0.4422 | Yes | ||
| 12 | LRPPRC | 16081 | -1.173 | -0.4093 | Yes | ||
| 13 | SVIL | 16626 | -1.318 | -0.3635 | Yes | ||
| 14 | DST | 16797 | -1.370 | -0.2946 | Yes | ||
| 15 | FLNA | 17553 | -1.672 | -0.2400 | Yes | ||
| 16 | ACTN4 | 18125 | -2.071 | -0.1528 | Yes | ||
| 17 | CYFIP1 | 18567 | -3.147 | 0.0026 | Yes |