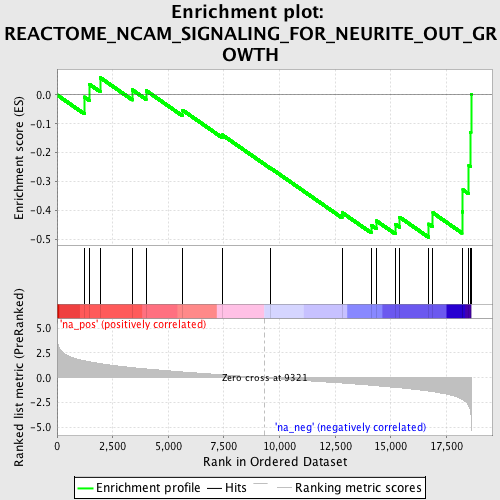
Profile of the Running ES Score & Positions of GeneSet Members on the Rank Ordered List
| Dataset | set03_wtNotch_versus_absentNotch |
| Phenotype | NoPhenotypeAvailable |
| Upregulated in class | na_neg |
| GeneSet | REACTOME_NCAM_SIGNALING_FOR_NEURITE_OUT_GROWTH |
| Enrichment Score (ES) | -0.49450552 |
| Normalized Enrichment Score (NES) | -1.5820009 |
| Nominal p-value | 0.032822758 |
| FDR q-value | 0.56064624 |
| FWER p-Value | 1.0 |
| PROBE | GENE SYMBOL | GENE_TITLE | RANK IN GENE LIST | RANK METRIC SCORE | RUNNING ES | CORE ENRICHMENT | |
|---|---|---|---|---|---|---|---|
| 1 | SOS1 | 1228 | 1.701 | -0.0070 | No | ||
| 2 | RPS6KA5 | 1456 | 1.611 | 0.0367 | No | ||
| 3 | NCAN | 1936 | 1.421 | 0.0603 | No | ||
| 4 | MAPK3 | 3384 | 1.017 | 0.0178 | No | ||
| 5 | AGRN | 3999 | 0.880 | 0.0153 | No | ||
| 6 | GFRA1 | 5638 | 0.582 | -0.0526 | No | ||
| 7 | PSPN | 7425 | 0.288 | -0.1386 | No | ||
| 8 | MAP2K1 | 9587 | -0.041 | -0.2534 | No | ||
| 9 | MAPK1 | 12809 | -0.532 | -0.4081 | No | ||
| 10 | KRAS | 14116 | -0.757 | -0.4521 | Yes | ||
| 11 | PTPRA | 14357 | -0.804 | -0.4371 | Yes | ||
| 12 | YWHAB | 15201 | -0.970 | -0.4487 | Yes | ||
| 13 | MAP2K2 | 15389 | -1.012 | -0.4236 | Yes | ||
| 14 | CNTN2 | 16708 | -1.346 | -0.4478 | Yes | ||
| 15 | PRNP | 16892 | -1.401 | -0.4090 | Yes | ||
| 16 | FYN | 18200 | -2.163 | -0.4042 | Yes | ||
| 17 | NCAM1 | 18242 | -2.217 | -0.3294 | Yes | ||
| 18 | RAF1 | 18508 | -2.852 | -0.2447 | Yes | ||
| 19 | CREB1 | 18587 | -3.440 | -0.1294 | Yes | ||
| 20 | PTK2 | 18604 | -3.772 | 0.0006 | Yes |
