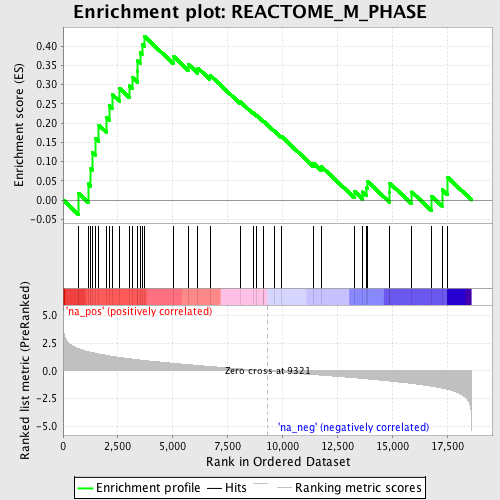
Profile of the Running ES Score & Positions of GeneSet Members on the Rank Ordered List
| Dataset | set03_wtNotch_versus_absentNotch |
| Phenotype | NoPhenotypeAvailable |
| Upregulated in class | na_pos |
| GeneSet | REACTOME_M_PHASE |
| Enrichment Score (ES) | 0.4257064 |
| Normalized Enrichment Score (NES) | 1.5805503 |
| Nominal p-value | 0.018181818 |
| FDR q-value | 0.43023166 |
| FWER p-Value | 1.0 |
| PROBE | GENE SYMBOL | GENE_TITLE | RANK IN GENE LIST | RANK METRIC SCORE | RUNNING ES | CORE ENRICHMENT | |
|---|---|---|---|---|---|---|---|
| 1 | NUP37 | 698 | 2.004 | 0.0176 | Yes | ||
| 2 | BUB1 | 1139 | 1.742 | 0.0419 | Yes | ||
| 3 | CENPC1 | 1267 | 1.685 | 0.0815 | Yes | ||
| 4 | NDC80 | 1336 | 1.656 | 0.1234 | Yes | ||
| 5 | SGOL1 | 1461 | 1.609 | 0.1610 | Yes | ||
| 6 | BUB3 | 1628 | 1.538 | 0.1945 | Yes | ||
| 7 | CLIP1 | 1983 | 1.403 | 0.2141 | Yes | ||
| 8 | BIRC5 | 2107 | 1.363 | 0.2450 | Yes | ||
| 9 | KIF2A | 2233 | 1.319 | 0.2746 | Yes | ||
| 10 | PLK1 | 2568 | 1.222 | 0.2902 | Yes | ||
| 11 | CDC20 | 3021 | 1.104 | 0.2963 | Yes | ||
| 12 | CENPA | 3152 | 1.069 | 0.3188 | Yes | ||
| 13 | SMC1A | 3389 | 1.016 | 0.3340 | Yes | ||
| 14 | RANBP2 | 3400 | 1.014 | 0.3614 | Yes | ||
| 15 | CDCA8 | 3509 | 0.989 | 0.3828 | Yes | ||
| 16 | STAG2 | 3598 | 0.967 | 0.4047 | Yes | ||
| 17 | RANGAP1 | 3694 | 0.947 | 0.4257 | Yes | ||
| 18 | SGOL2 | 5017 | 0.692 | 0.3736 | No | ||
| 19 | BUB1B | 5698 | 0.573 | 0.3528 | No | ||
| 20 | PMF1 | 6140 | 0.499 | 0.3428 | No | ||
| 21 | KIF23 | 6694 | 0.408 | 0.3243 | No | ||
| 22 | KIF2B | 8071 | 0.193 | 0.2555 | No | ||
| 23 | MAD2L1 | 8654 | 0.100 | 0.2269 | No | ||
| 24 | RAD21 | 8821 | 0.074 | 0.2201 | No | ||
| 25 | NUP160 | 9115 | 0.031 | 0.2051 | No | ||
| 26 | KNTC1 | 9137 | 0.029 | 0.2048 | No | ||
| 27 | CLASP2 | 9614 | -0.046 | 0.1804 | No | ||
| 28 | XPO1 | 9942 | -0.106 | 0.1658 | No | ||
| 29 | SEC13 | 11423 | -0.327 | 0.0951 | No | ||
| 30 | KIF20A | 11772 | -0.377 | 0.0867 | No | ||
| 31 | PPP1CC | 13267 | -0.607 | 0.0230 | No | ||
| 32 | MAPRE1 | 13653 | -0.675 | 0.0209 | No | ||
| 33 | MLF1IP | 13817 | -0.705 | 0.0315 | No | ||
| 34 | ZWINT | 13859 | -0.712 | 0.0489 | No | ||
| 35 | NUP43 | 14887 | -0.910 | 0.0187 | No | ||
| 36 | CENPE | 14892 | -0.911 | 0.0435 | No | ||
| 37 | ZW10 | 15890 | -1.125 | 0.0209 | No | ||
| 38 | PAFAH1B1 | 16784 | -1.367 | 0.0104 | No | ||
| 39 | CLASP1 | 17271 | -1.547 | 0.0269 | No | ||
| 40 | NUP107 | 17523 | -1.651 | 0.0588 | No |
