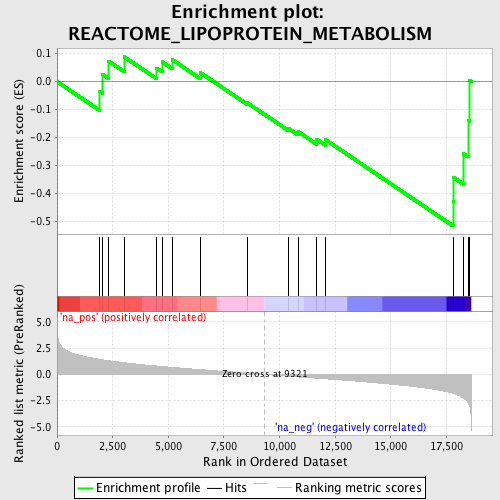
Profile of the Running ES Score & Positions of GeneSet Members on the Rank Ordered List
| Dataset | set03_wtNotch_versus_absentNotch |
| Phenotype | NoPhenotypeAvailable |
| Upregulated in class | na_neg |
| GeneSet | REACTOME_LIPOPROTEIN_METABOLISM |
| Enrichment Score (ES) | -0.5154748 |
| Normalized Enrichment Score (NES) | -1.5882558 |
| Nominal p-value | 0.025641026 |
| FDR q-value | 0.5661112 |
| FWER p-Value | 1.0 |
| PROBE | GENE SYMBOL | GENE_TITLE | RANK IN GENE LIST | RANK METRIC SCORE | RUNNING ES | CORE ENRICHMENT | |
|---|---|---|---|---|---|---|---|
| 1 | APOA4 | 1921 | 1.426 | -0.0347 | No | ||
| 2 | LIPC | 2037 | 1.384 | 0.0257 | No | ||
| 3 | APOC2 | 2315 | 1.294 | 0.0731 | No | ||
| 4 | A2M | 3016 | 1.106 | 0.0886 | No | ||
| 5 | LDLR | 4474 | 0.793 | 0.0484 | No | ||
| 6 | APOB | 4728 | 0.743 | 0.0705 | No | ||
| 7 | APOC3 | 5175 | 0.662 | 0.0784 | No | ||
| 8 | APOA2 | 6433 | 0.448 | 0.0324 | No | ||
| 9 | APOA5 | 8547 | 0.118 | -0.0756 | No | ||
| 10 | LCAT | 10384 | -0.170 | -0.1661 | No | ||
| 11 | CUBN | 10837 | -0.240 | -0.1788 | No | ||
| 12 | APOA1 | 11666 | -0.360 | -0.2060 | No | ||
| 13 | ABCA1 | 12059 | -0.419 | -0.2070 | No | ||
| 14 | MTTP | 17798 | -1.804 | -0.4287 | Yes | ||
| 15 | P4HB | 17820 | -1.820 | -0.3423 | Yes | ||
| 16 | HSPG2 | 18270 | -2.263 | -0.2576 | Yes | ||
| 17 | APOE | 18476 | -2.722 | -0.1377 | Yes | ||
| 18 | LPL | 18546 | -3.018 | 0.0038 | Yes |
