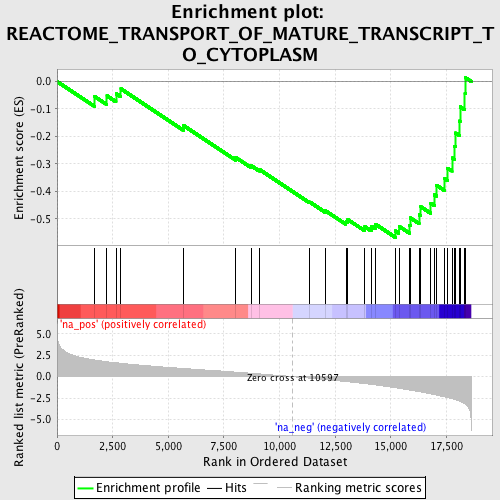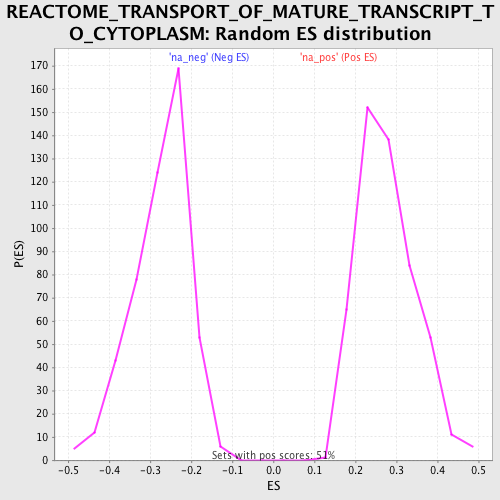
Profile of the Running ES Score & Positions of GeneSet Members on the Rank Ordered List
| Dataset | set03_truncNotch_versus_wtNotch |
| Phenotype | NoPhenotypeAvailable |
| Upregulated in class | na_neg |
| GeneSet | REACTOME_TRANSPORT_OF_MATURE_TRANSCRIPT_TO_CYTOPLASM |
| Enrichment Score (ES) | -0.5680795 |
| Normalized Enrichment Score (NES) | -2.0785327 |
| Nominal p-value | 0.0 |
| FDR q-value | 0.0060240473 |
| FWER p-Value | 0.07 |

| PROBE | GENE SYMBOL | GENE_TITLE | RANK IN GENE LIST | RANK METRIC SCORE | RUNNING ES | CORE ENRICHMENT | |
|---|---|---|---|---|---|---|---|
| 1 | U2AF2 | 1684 | 1.950 | -0.0544 | No | ||
| 2 | NUP188 | 2241 | 1.736 | -0.0521 | No | ||
| 3 | NUP62 | 2647 | 1.622 | -0.0437 | No | ||
| 4 | SRRM1 | 2869 | 1.556 | -0.0267 | No | ||
| 5 | RNPS1 | 5670 | 0.953 | -0.1596 | No | ||
| 6 | U2AF1 | 8030 | 0.525 | -0.2768 | No | ||
| 7 | NFX1 | 8716 | 0.396 | -0.3063 | No | ||
| 8 | NUP35 | 9086 | 0.325 | -0.3201 | No | ||
| 9 | SFRS9 | 11352 | -0.172 | -0.4388 | No | ||
| 10 | RAE1 | 12061 | -0.339 | -0.4706 | No | ||
| 11 | MAGOH | 12985 | -0.571 | -0.5097 | No | ||
| 12 | THOC4 | 13068 | -0.594 | -0.5030 | No | ||
| 13 | NUPL2 | 13833 | -0.818 | -0.5289 | No | ||
| 14 | NUP43 | 14122 | -0.908 | -0.5276 | No | ||
| 15 | NUP153 | 14299 | -0.964 | -0.5191 | No | ||
| 16 | SFRS7 | 15210 | -1.289 | -0.5441 | Yes | ||
| 17 | SLBP | 15367 | -1.349 | -0.5274 | Yes | ||
| 18 | NCBP2 | 15840 | -1.552 | -0.5240 | Yes | ||
| 19 | SFRS5 | 15877 | -1.569 | -0.4968 | Yes | ||
| 20 | NUP155 | 16271 | -1.744 | -0.4855 | Yes | ||
| 21 | CPSF1 | 16348 | -1.786 | -0.4564 | Yes | ||
| 22 | NUP37 | 16797 | -2.018 | -0.4430 | Yes | ||
| 23 | NUP160 | 16956 | -2.095 | -0.4126 | Yes | ||
| 24 | RANBP2 | 17048 | -2.144 | -0.3777 | Yes | ||
| 25 | NUP93 | 17425 | -2.364 | -0.3540 | Yes | ||
| 26 | SFRS2 | 17548 | -2.439 | -0.3152 | Yes | ||
| 27 | NUP54 | 17751 | -2.571 | -0.2783 | Yes | ||
| 28 | SFRS3 | 17871 | -2.665 | -0.2352 | Yes | ||
| 29 | TPR | 17914 | -2.694 | -0.1874 | Yes | ||
| 30 | EIF4E | 18085 | -2.842 | -0.1437 | Yes | ||
| 31 | NUP107 | 18117 | -2.875 | -0.0920 | Yes | ||
| 32 | SFRS1 | 18333 | -3.183 | -0.0444 | Yes | ||
| 33 | SFRS6 | 18350 | -3.206 | 0.0143 | Yes |
