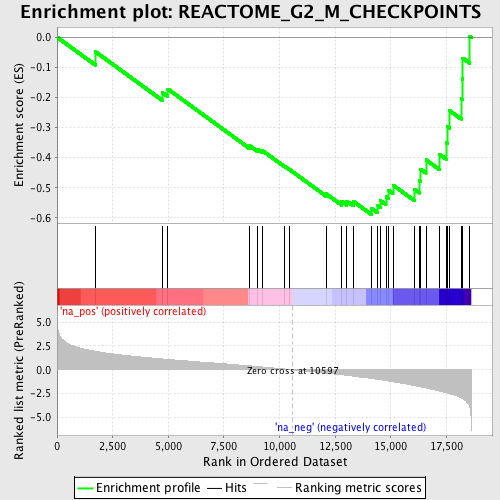
Profile of the Running ES Score & Positions of GeneSet Members on the Rank Ordered List
| Dataset | set03_truncNotch_versus_wtNotch |
| Phenotype | NoPhenotypeAvailable |
| Upregulated in class | na_neg |
| GeneSet | REACTOME_G2_M_CHECKPOINTS |
| Enrichment Score (ES) | -0.588842 |
| Normalized Enrichment Score (NES) | -2.0847664 |
| Nominal p-value | 0.0 |
| FDR q-value | 0.0059749796 |
| FWER p-Value | 0.065 |
| PROBE | GENE SYMBOL | GENE_TITLE | RANK IN GENE LIST | RANK METRIC SCORE | RUNNING ES | CORE ENRICHMENT | |
|---|---|---|---|---|---|---|---|
| 1 | RPA2 | 1719 | 1.935 | -0.0479 | No | ||
| 2 | MCM7 | 4727 | 1.130 | -0.1837 | No | ||
| 3 | RFC5 | 4981 | 1.084 | -0.1723 | No | ||
| 4 | RAD1 | 8641 | 0.409 | -0.3598 | No | ||
| 5 | MCM5 | 9024 | 0.339 | -0.3725 | No | ||
| 6 | MCM2 | 9236 | 0.291 | -0.3772 | No | ||
| 7 | MCM3 | 10237 | 0.078 | -0.4292 | No | ||
| 8 | RFC3 | 10437 | 0.034 | -0.4391 | No | ||
| 9 | MCM10 | 12091 | -0.345 | -0.5201 | No | ||
| 10 | CHEK1 | 12792 | -0.517 | -0.5458 | No | ||
| 11 | CDC25A | 13018 | -0.579 | -0.5446 | No | ||
| 12 | ORC2L | 13315 | -0.665 | -0.5452 | No | ||
| 13 | ATM | 14127 | -0.911 | -0.5679 | Yes | ||
| 14 | CCNB2 | 14418 | -1.002 | -0.5604 | Yes | ||
| 15 | ORC1L | 14523 | -1.032 | -0.5422 | Yes | ||
| 16 | WEE1 | 14784 | -1.131 | -0.5302 | Yes | ||
| 17 | RFC4 | 14912 | -1.173 | -0.5100 | Yes | ||
| 18 | MCM6 | 15098 | -1.246 | -0.4912 | Yes | ||
| 19 | RPA3 | 16062 | -1.655 | -0.5049 | Yes | ||
| 20 | CDC25C | 16298 | -1.762 | -0.4770 | Yes | ||
| 21 | ORC5L | 16341 | -1.784 | -0.4382 | Yes | ||
| 22 | CDC45L | 16582 | -1.897 | -0.4074 | Yes | ||
| 23 | RPA1 | 17181 | -2.221 | -0.3884 | Yes | ||
| 24 | CDK2 | 17488 | -2.401 | -0.3496 | Yes | ||
| 25 | CCNB1 | 17554 | -2.442 | -0.2969 | Yes | ||
| 26 | RAD9B | 17646 | -2.503 | -0.2442 | Yes | ||
| 27 | CDC7 | 18162 | -2.928 | -0.2044 | Yes | ||
| 28 | HUS1 | 18218 | -3.005 | -0.1382 | Yes | ||
| 29 | MCM4 | 18238 | -3.033 | -0.0694 | Yes | ||
| 30 | ORC4L | 18548 | -3.893 | 0.0037 | Yes |
