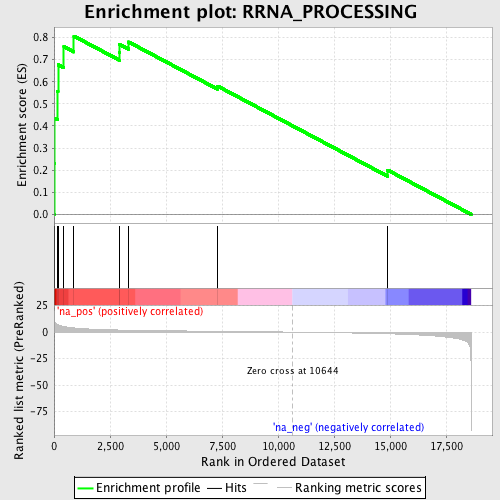
Profile of the Running ES Score & Positions of GeneSet Members on the Rank Ordered List
| Dataset | set03_truncNotch_versus_normalThy |
| Phenotype | NoPhenotypeAvailable |
| Upregulated in class | na_pos |
| GeneSet | RRNA_PROCESSING |
| Enrichment Score (ES) | 0.80629855 |
| Normalized Enrichment Score (NES) | 1.9956676 |
| Nominal p-value | 0.0 |
| FDR q-value | 0.011302832 |
| FWER p-Value | 0.07 |
| PROBE | GENE SYMBOL | GENE_TITLE | RANK IN GENE LIST | RANK METRIC SCORE | RUNNING ES | CORE ENRICHMENT | |
|---|---|---|---|---|---|---|---|
| 1 | NOLA2 | 8 | 12.656 | 0.2311 | Yes | ||
| 2 | FBL | 17 | 11.169 | 0.4350 | Yes | ||
| 3 | NOLC1 | 155 | 6.941 | 0.5547 | Yes | ||
| 4 | RRP9 | 175 | 6.757 | 0.6773 | Yes | ||
| 5 | EXOSC2 | 438 | 5.206 | 0.7584 | Yes | ||
| 6 | GEMIN4 | 885 | 3.927 | 0.8063 | Yes | ||
| 7 | NOL5A | 2909 | 1.963 | 0.7335 | No | ||
| 8 | EXOSC3 | 2920 | 1.960 | 0.7688 | No | ||
| 9 | EXOSC7 | 3325 | 1.786 | 0.7798 | No | ||
| 10 | POP4 | 7291 | 0.763 | 0.5806 | No | ||
| 11 | RPS14 | 14881 | -1.531 | 0.2007 | No |
