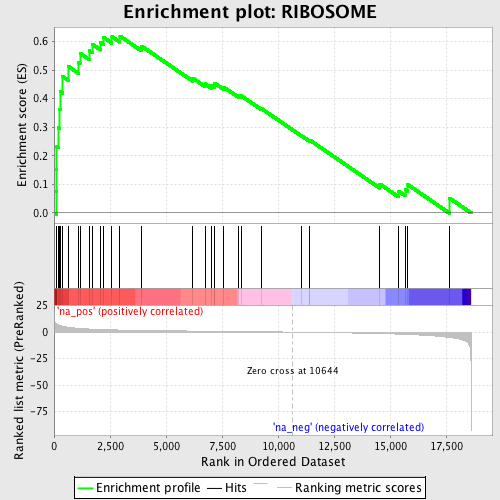
Profile of the Running ES Score & Positions of GeneSet Members on the Rank Ordered List
| Dataset | set03_truncNotch_versus_normalThy |
| Phenotype | NoPhenotypeAvailable |
| Upregulated in class | na_pos |
| GeneSet | RIBOSOME |
| Enrichment Score (ES) | 0.61898696 |
| Normalized Enrichment Score (NES) | 2.069742 |
| Nominal p-value | 0.0 |
| FDR q-value | 0.013279653 |
| FWER p-Value | 0.024 |
| PROBE | GENE SYMBOL | GENE_TITLE | RANK IN GENE LIST | RANK METRIC SCORE | RUNNING ES | CORE ENRICHMENT | |
|---|---|---|---|---|---|---|---|
| 1 | APEX1 | 97 | 7.594 | 0.0758 | Yes | ||
| 2 | MRPS10 | 116 | 7.370 | 0.1534 | Yes | ||
| 3 | MRPS15 | 121 | 7.306 | 0.2312 | Yes | ||
| 4 | MRPS18A | 184 | 6.684 | 0.2991 | Yes | ||
| 5 | MRPL55 | 256 | 6.167 | 0.3611 | Yes | ||
| 6 | MRPL12 | 269 | 6.106 | 0.4256 | Yes | ||
| 7 | MRPS28 | 387 | 5.471 | 0.4777 | Yes | ||
| 8 | MRPS11 | 625 | 4.545 | 0.5134 | Yes | ||
| 9 | MRPL10 | 1103 | 3.518 | 0.5253 | Yes | ||
| 10 | RPL7A | 1160 | 3.436 | 0.5589 | Yes | ||
| 11 | RPL3L | 1572 | 2.908 | 0.5678 | Yes | ||
| 12 | MRPS12 | 1719 | 2.761 | 0.5894 | Yes | ||
| 13 | MRPS35 | 2074 | 2.453 | 0.5965 | Yes | ||
| 14 | SRP68 | 2199 | 2.365 | 0.6151 | Yes | ||
| 15 | MRPS24 | 2582 | 2.139 | 0.6173 | Yes | ||
| 16 | MRPS16 | 2939 | 1.950 | 0.6190 | Yes | ||
| 17 | MRPL23 | 3905 | 1.593 | 0.5841 | No | ||
| 18 | RRBP1 | 6191 | 1.013 | 0.4719 | No | ||
| 19 | FMR1 | 6738 | 0.882 | 0.4519 | No | ||
| 20 | MRPL40 | 7020 | 0.822 | 0.4456 | No | ||
| 21 | RPS4X | 7148 | 0.791 | 0.4472 | No | ||
| 22 | FAU | 7165 | 0.789 | 0.4547 | No | ||
| 23 | MRPS22 | 7572 | 0.706 | 0.4404 | No | ||
| 24 | MRPS18C | 8240 | 0.564 | 0.4105 | No | ||
| 25 | RPL13A | 8348 | 0.541 | 0.4105 | No | ||
| 26 | MRPL52 | 9239 | 0.348 | 0.3664 | No | ||
| 27 | NR0B1 | 11061 | -0.104 | 0.2695 | No | ||
| 28 | RPL27 | 11409 | -0.206 | 0.2530 | No | ||
| 29 | MRPS36 | 11420 | -0.209 | 0.2547 | No | ||
| 30 | RPS7 | 14537 | -1.343 | 0.1013 | No | ||
| 31 | RPS11 | 15366 | -1.853 | 0.0766 | No | ||
| 32 | MRPS21 | 15668 | -2.072 | 0.0825 | No | ||
| 33 | MRPL51 | 15782 | -2.171 | 0.0995 | No | ||
| 34 | RPL15 | 17642 | -4.959 | 0.0524 | No |
