Profile of the Running ES Score & Positions of GeneSet Members on the Rank Ordered List
| Dataset | set03_truncNotch_versus_normalThy |
| Phenotype | NoPhenotypeAvailable |
| Upregulated in class | na_pos |
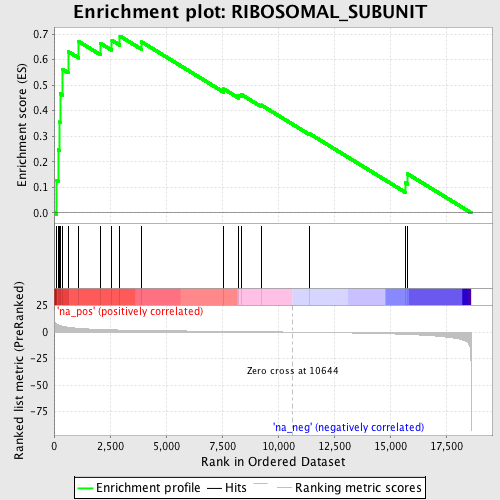
| GeneSet | RIBOSOMAL_SUBUNIT |
| Enrichment Score (ES) | 0.69203824 |
| Normalized Enrichment Score (NES) | 1.906158 |
| Nominal p-value | 0.002444988 |
| FDR q-value | 0.02225986 |
| FWER p-Value | 0.273 |
| PROBE | GENE SYMBOL | GENE_TITLE | RANK IN GENE LIST | RANK METRIC SCORE | RUNNING ES | CORE ENRICHMENT | |
|---|---|---|---|---|---|---|---|
| 1 | MRPS15 | 121 | 7.306 | 0.1274 | Yes | ||
| 2 | MRPS18A | 184 | 6.684 | 0.2467 | Yes | ||
| 3 | MRPL55 | 256 | 6.167 | 0.3559 | Yes | ||
| 4 | MRPL12 | 269 | 6.106 | 0.4672 | Yes | ||
| 5 | MRPS28 | 387 | 5.471 | 0.5612 | Yes | ||
| 6 | MRPS11 | 625 | 4.545 | 0.6318 | Yes | ||
| 7 | MRPL10 | 1103 | 3.518 | 0.6706 | Yes | ||
| 8 | MRPS35 | 2074 | 2.453 | 0.6635 | Yes | ||
| 9 | MRPS24 | 2582 | 2.139 | 0.6754 | Yes | ||
| 10 | MRPS16 | 2939 | 1.950 | 0.6920 | Yes | ||
| 11 | MRPL23 | 3905 | 1.593 | 0.6694 | No | ||
| 12 | MRPS22 | 7572 | 0.706 | 0.4852 | No | ||
| 13 | MRPS18C | 8240 | 0.564 | 0.4597 | No | ||
| 14 | RPL13A | 8348 | 0.541 | 0.4638 | No | ||
| 15 | MRPL52 | 9239 | 0.348 | 0.4224 | No | ||
| 16 | MRPS36 | 11420 | -0.209 | 0.3090 | No | ||
| 17 | MRPS21 | 15668 | -2.072 | 0.1186 | No | ||
| 18 | MRPL51 | 15782 | -2.171 | 0.1524 | No |
