Profile of the Running ES Score & Positions of GeneSet Members on the Rank Ordered List
| Dataset | set03_truncNotch_versus_normalThy |
| Phenotype | NoPhenotypeAvailable |
| Upregulated in class | na_neg |
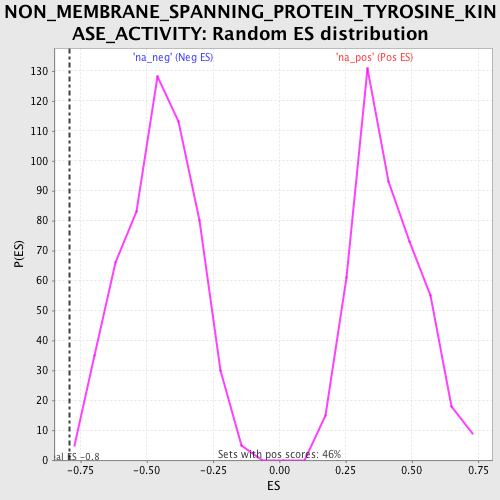
| GeneSet | NON_MEMBRANE_SPANNING_PROTEIN_TYROSINE_KINASE_ACTIVITY |
| Enrichment Score (ES) | -0.7919157 |
| Normalized Enrichment Score (NES) | -1.7521446 |
| Nominal p-value | 0.0018348624 |
| FDR q-value | 0.3112749 |
| FWER p-Value | 0.985 |
| PROBE | GENE SYMBOL | GENE_TITLE | RANK IN GENE LIST | RANK METRIC SCORE | RUNNING ES | CORE ENRICHMENT | |
|---|---|---|---|---|---|---|---|
| 1 | TYK2 | 2072 | 2.454 | -0.0665 | No | ||
| 2 | ERBB2 | 3597 | 1.691 | -0.1174 | No | ||
| 3 | TXK | 6618 | 0.911 | -0.2631 | No | ||
| 4 | PTK6 | 10129 | 0.143 | -0.4491 | No | ||
| 5 | FRK | 12329 | -0.475 | -0.5586 | No | ||
| 6 | TNK2 | 15043 | -1.626 | -0.6747 | No | ||
| 7 | CLK1 | 16675 | -3.155 | -0.7046 | Yes | ||
| 8 | PTK2B | 18300 | -7.881 | -0.6477 | Yes | ||
| 9 | DYRK1A | 18309 | -8.008 | -0.5016 | Yes | ||
| 10 | ITK | 18503 | -10.655 | -0.3171 | Yes | ||
| 11 | TEC | 18583 | -17.660 | 0.0018 | Yes |