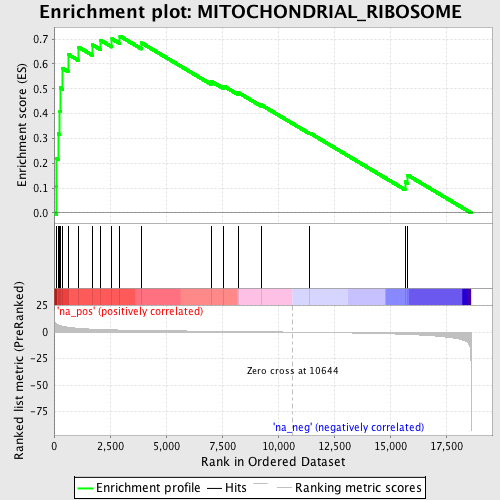
Profile of the Running ES Score & Positions of GeneSet Members on the Rank Ordered List
| Dataset | set03_truncNotch_versus_normalThy |
| Phenotype | NoPhenotypeAvailable |
| Upregulated in class | na_pos |
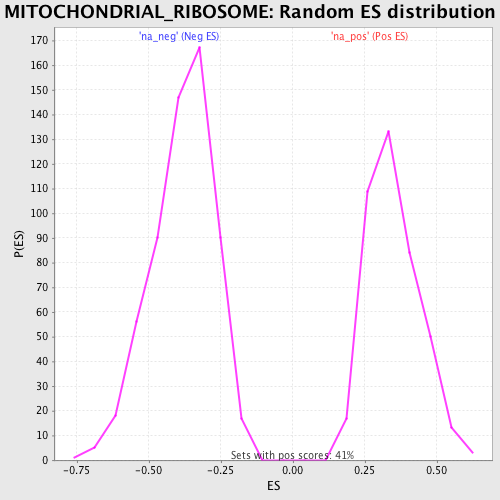
| GeneSet | MITOCHONDRIAL_RIBOSOME |
| Enrichment Score (ES) | 0.7119189 |
| Normalized Enrichment Score (NES) | 2.0547168 |
| Nominal p-value | 0.0 |
| FDR q-value | 0.009938934 |
| FWER p-Value | 0.035 |
| PROBE | GENE SYMBOL | GENE_TITLE | RANK IN GENE LIST | RANK METRIC SCORE | RUNNING ES | CORE ENRICHMENT | |
|---|---|---|---|---|---|---|---|
| 1 | MRPS10 | 116 | 7.370 | 0.1072 | Yes | ||
| 2 | MRPS15 | 121 | 7.306 | 0.2195 | Yes | ||
| 3 | MRPS18A | 184 | 6.684 | 0.3191 | Yes | ||
| 4 | MRPL55 | 256 | 6.167 | 0.4102 | Yes | ||
| 5 | MRPL12 | 269 | 6.106 | 0.5035 | Yes | ||
| 6 | MRPS28 | 387 | 5.471 | 0.5815 | Yes | ||
| 7 | MRPS11 | 625 | 4.545 | 0.6387 | Yes | ||
| 8 | MRPL10 | 1103 | 3.518 | 0.6672 | Yes | ||
| 9 | MRPS12 | 1719 | 2.761 | 0.6766 | Yes | ||
| 10 | MRPS35 | 2074 | 2.453 | 0.6954 | Yes | ||
| 11 | MRPS24 | 2582 | 2.139 | 0.7010 | Yes | ||
| 12 | MRPS16 | 2939 | 1.950 | 0.7119 | Yes | ||
| 13 | MRPL23 | 3905 | 1.593 | 0.6846 | No | ||
| 14 | MRPL40 | 7020 | 0.822 | 0.5298 | No | ||
| 15 | MRPS22 | 7572 | 0.706 | 0.5110 | No | ||
| 16 | MRPS18C | 8240 | 0.564 | 0.4838 | No | ||
| 17 | MRPL52 | 9239 | 0.348 | 0.4355 | No | ||
| 18 | MRPS36 | 11420 | -0.209 | 0.3215 | No | ||
| 19 | MRPS21 | 15668 | -2.072 | 0.1250 | No | ||
| 20 | MRPL51 | 15782 | -2.171 | 0.1524 | No |