Profile of the Running ES Score & Positions of GeneSet Members on the Rank Ordered List
| Dataset | set03_truncNotch_versus_normalThy |
| Phenotype | NoPhenotypeAvailable |
| Upregulated in class | na_pos |
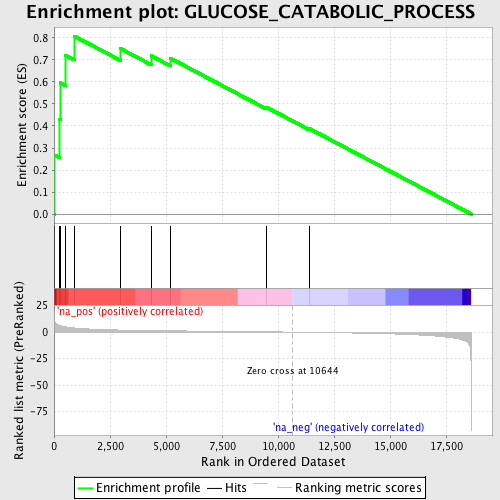
| GeneSet | GLUCOSE_CATABOLIC_PROCESS |
| Enrichment Score (ES) | 0.80827206 |
| Normalized Enrichment Score (NES) | 1.9707372 |
| Nominal p-value | 0.002232143 |
| FDR q-value | 0.017177261 |
| FWER p-Value | 0.117 |
| PROBE | GENE SYMBOL | GENE_TITLE | RANK IN GENE LIST | RANK METRIC SCORE | RUNNING ES | CORE ENRICHMENT | |
|---|---|---|---|---|---|---|---|
| 1 | ALDOA | 36 | 9.687 | 0.2675 | Yes | ||
| 2 | PFKM | 243 | 6.212 | 0.4292 | Yes | ||
| 3 | PFKL | 274 | 6.060 | 0.5961 | Yes | ||
| 4 | PGLS | 509 | 4.948 | 0.7211 | Yes | ||
| 5 | PGD | 904 | 3.894 | 0.8083 | Yes | ||
| 6 | GAPDHS | 2969 | 1.939 | 0.7513 | No | ||
| 7 | PFKFB1 | 4340 | 1.468 | 0.7185 | No | ||
| 8 | TKTL1 | 5182 | 1.252 | 0.7081 | No | ||
| 9 | HK1 | 9478 | 0.294 | 0.4855 | No | ||
| 10 | ALDOB | 11388 | -0.201 | 0.3885 | No |
