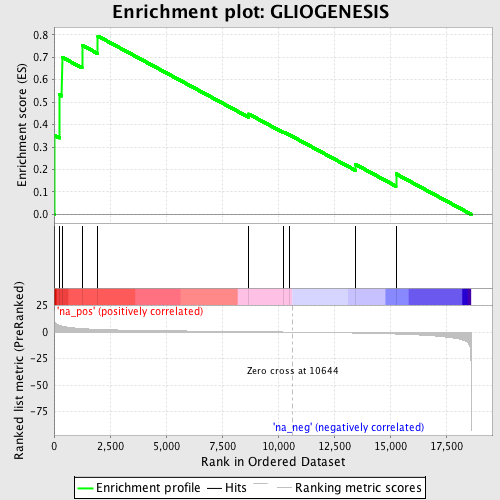
Profile of the Running ES Score & Positions of GeneSet Members on the Rank Ordered List
| Dataset | set03_truncNotch_versus_normalThy |
| Phenotype | NoPhenotypeAvailable |
| Upregulated in class | na_pos |
| GeneSet | GLIOGENESIS |
| Enrichment Score (ES) | 0.79430044 |
| Normalized Enrichment Score (NES) | 1.8968191 |
| Nominal p-value | 0.0 |
| FDR q-value | 0.024423683 |
| FWER p-Value | 0.315 |
| PROBE | GENE SYMBOL | GENE_TITLE | RANK IN GENE LIST | RANK METRIC SCORE | RUNNING ES | CORE ENRICHMENT | |
|---|---|---|---|---|---|---|---|
| 1 | EIF2B5 | 14 | 11.437 | 0.3520 | Yes | ||
| 2 | EIF2B3 | 236 | 6.269 | 0.5334 | Yes | ||
| 3 | SOD1 | 352 | 5.616 | 0.7005 | Yes | ||
| 4 | EIF2B1 | 1247 | 3.300 | 0.7542 | Yes | ||
| 5 | EIF2B2 | 1955 | 2.532 | 0.7943 | Yes | ||
| 6 | SLIT2 | 8684 | 0.470 | 0.4472 | No | ||
| 7 | CDK6 | 10258 | 0.112 | 0.3661 | No | ||
| 8 | EIF2B4 | 10514 | 0.040 | 0.3536 | No | ||
| 9 | NF1 | 13440 | -0.869 | 0.2232 | No | ||
| 10 | NF2 | 15263 | -1.779 | 0.1802 | No |
