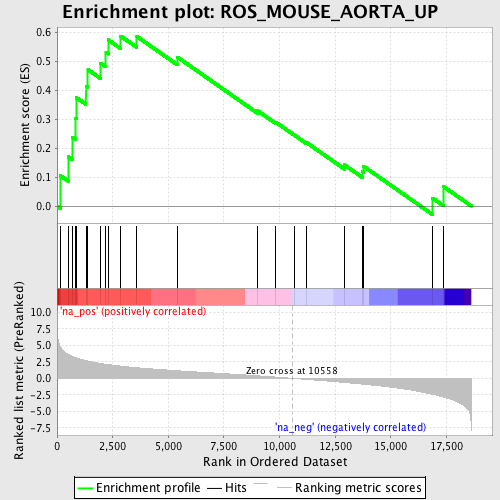
Profile of the Running ES Score & Positions of GeneSet Members on the Rank Ordered List
| Dataset | set03_truncNotch_versus_absentNotch |
| Phenotype | NoPhenotypeAvailable |
| Upregulated in class | na_pos |
| GeneSet | ROS_MOUSE_AORTA_UP |
| Enrichment Score (ES) | 0.5861589 |
| Normalized Enrichment Score (NES) | 1.8326283 |
| Nominal p-value | 0.0037105752 |
| FDR q-value | 0.08057203 |
| FWER p-Value | 0.78 |
| PROBE | GENE SYMBOL | GENE_TITLE | RANK IN GENE LIST | RANK METRIC SCORE | RUNNING ES | CORE ENRICHMENT | |
|---|---|---|---|---|---|---|---|
| 1 | PEX6 | 146 | 4.783 | 0.1047 | Yes | ||
| 2 | NDUFB10 | 511 | 3.599 | 0.1698 | Yes | ||
| 3 | VEGFB | 693 | 3.290 | 0.2375 | Yes | ||
| 4 | UBE2M | 825 | 3.114 | 0.3037 | Yes | ||
| 5 | TYSND1 | 870 | 3.074 | 0.3736 | Yes | ||
| 6 | SDHB | 1298 | 2.680 | 0.4137 | Yes | ||
| 7 | NDUFS3 | 1387 | 2.608 | 0.4703 | Yes | ||
| 8 | MRPL4 | 1950 | 2.245 | 0.4929 | Yes | ||
| 9 | DGAT1 | 2196 | 2.124 | 0.5297 | Yes | ||
| 10 | PNPLA2 | 2296 | 2.077 | 0.5733 | Yes | ||
| 11 | AKT2 | 2861 | 1.837 | 0.5862 | Yes | ||
| 12 | AQP7 | 3586 | 1.601 | 0.5849 | No | ||
| 13 | CYP4B1 | 5403 | 1.138 | 0.5140 | No | ||
| 14 | THEM2 | 9020 | 0.365 | 0.3281 | No | ||
| 15 | FABP3 | 9822 | 0.185 | 0.2894 | No | ||
| 16 | PPARA | 10656 | -0.023 | 0.2451 | No | ||
| 17 | ATP5G3 | 11197 | -0.161 | 0.2199 | No | ||
| 18 | COX17 | 12920 | -0.619 | 0.1419 | No | ||
| 19 | CES1 | 13728 | -0.871 | 0.1189 | No | ||
| 20 | CIB2 | 13777 | -0.886 | 0.1372 | No | ||
| 21 | SLC25A5 | 16871 | -2.405 | 0.0275 | No | ||
| 22 | HSPD1 | 17355 | -2.819 | 0.0678 | No |
