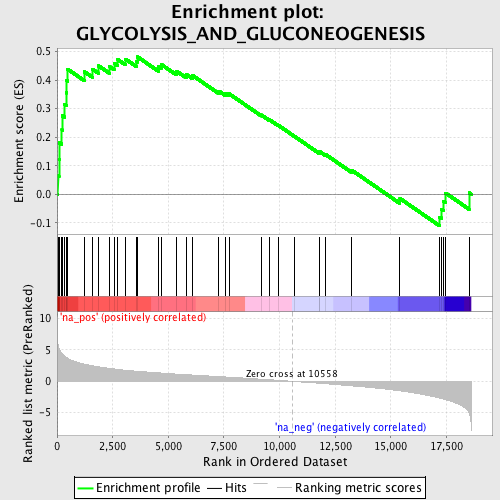
Profile of the Running ES Score & Positions of GeneSet Members on the Rank Ordered List
| Dataset | set03_truncNotch_versus_absentNotch |
| Phenotype | NoPhenotypeAvailable |
| Upregulated in class | na_pos |
| GeneSet | GLYCOLYSIS_AND_GLUCONEOGENESIS |
| Enrichment Score (ES) | 0.48122475 |
| Normalized Enrichment Score (NES) | 1.7370052 |
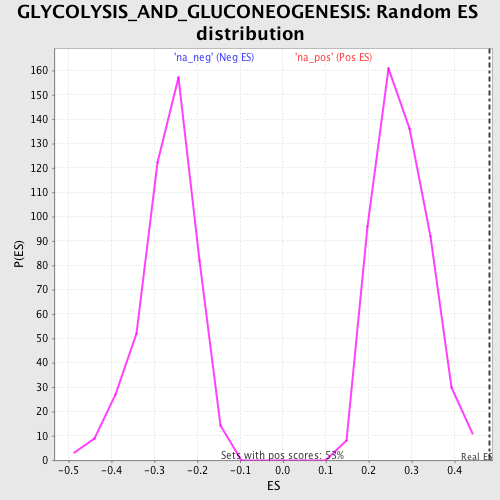
| Nominal p-value | 0.0 |
| FDR q-value | 0.18146376 |
| FWER p-Value | 0.983 |
| PROBE | GENE SYMBOL | GENE_TITLE | RANK IN GENE LIST | RANK METRIC SCORE | RUNNING ES | CORE ENRICHMENT | |
|---|---|---|---|---|---|---|---|
| 1 | ALDOA | 39 | 5.848 | 0.0655 | Yes | ||
| 2 | FBP1 | 88 | 5.157 | 0.1225 | Yes | ||
| 3 | GOT1 | 97 | 5.074 | 0.1807 | Yes | ||
| 4 | PGAM2 | 216 | 4.414 | 0.2254 | Yes | ||
| 5 | PGAM1 | 232 | 4.372 | 0.2751 | Yes | ||
| 6 | PKM2 | 336 | 4.023 | 0.3161 | Yes | ||
| 7 | GOT2 | 419 | 3.766 | 0.3552 | Yes | ||
| 8 | ENO3 | 433 | 3.738 | 0.3977 | Yes | ||
| 9 | ENO1 | 470 | 3.677 | 0.4382 | Yes | ||
| 10 | TPI1 | 1231 | 2.726 | 0.4288 | Yes | ||
| 11 | PFKM | 1598 | 2.460 | 0.4376 | Yes | ||
| 12 | GAPDHS | 1867 | 2.293 | 0.4496 | Yes | ||
| 13 | PFKL | 2361 | 2.045 | 0.4467 | Yes | ||
| 14 | GAPDH | 2565 | 1.964 | 0.4585 | Yes | ||
| 15 | HK3 | 2725 | 1.892 | 0.4718 | Yes | ||
| 16 | PFKP | 3081 | 1.754 | 0.4730 | Yes | ||
| 17 | FBP2 | 3578 | 1.604 | 0.4648 | Yes | ||
| 18 | PCK1 | 3616 | 1.591 | 0.4812 | Yes | ||
| 19 | LDHA | 4553 | 1.343 | 0.4464 | No | ||
| 20 | HK1 | 4677 | 1.314 | 0.4549 | No | ||
| 21 | GCK | 5366 | 1.148 | 0.4312 | No | ||
| 22 | TNFAIP1 | 5810 | 1.051 | 0.4195 | No | ||
| 23 | PGK2 | 6085 | 0.996 | 0.4162 | No | ||
| 24 | MDH2 | 7264 | 0.758 | 0.3616 | No | ||
| 25 | G6PC | 7583 | 0.687 | 0.3524 | No | ||
| 26 | PGK1 | 7733 | 0.661 | 0.3520 | No | ||
| 27 | PDHA2 | 9182 | 0.327 | 0.2779 | No | ||
| 28 | LDHC | 9556 | 0.248 | 0.2607 | No | ||
| 29 | ALDOB | 9949 | 0.153 | 0.2413 | No | ||
| 30 | ENO2 | 10667 | -0.027 | 0.2030 | No | ||
| 31 | PDHX | 11779 | -0.309 | 0.1468 | No | ||
| 32 | LDHAL6B | 11801 | -0.317 | 0.1493 | No | ||
| 33 | ALDOC | 12047 | -0.381 | 0.1406 | No | ||
| 34 | MDH1 | 13233 | -0.716 | 0.0850 | No | ||
| 35 | PKLR | 15407 | -1.519 | -0.0144 | No | ||
| 36 | HK2 | 17200 | -2.687 | -0.0798 | No | ||
| 37 | DLD | 17281 | -2.760 | -0.0522 | No | ||
| 38 | DLAT | 17359 | -2.822 | -0.0237 | No | ||
| 39 | PDHA1 | 17462 | -2.916 | 0.0045 | No | ||
| 40 | PDHB | 18521 | -4.980 | 0.0051 | No |