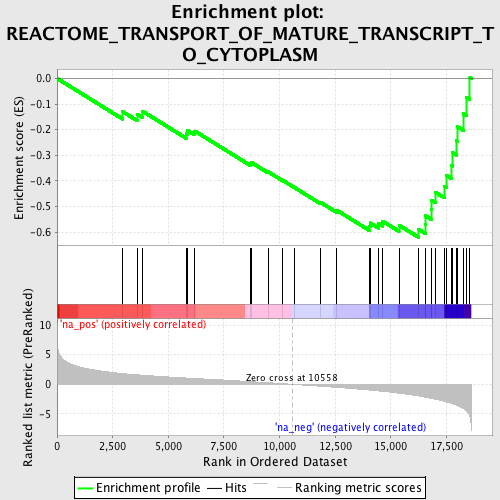
Profile of the Running ES Score & Positions of GeneSet Members on the Rank Ordered List
| Dataset | set03_truncNotch_versus_absentNotch |
| Phenotype | NoPhenotypeAvailable |
| Upregulated in class | na_neg |
| GeneSet | REACTOME_TRANSPORT_OF_MATURE_TRANSCRIPT_TO_CYTOPLASM |
| Enrichment Score (ES) | -0.6206966 |
| Normalized Enrichment Score (NES) | -2.1632612 |
| Nominal p-value | 0.0 |
| FDR q-value | 0.0027147904 |
| FWER p-Value | 0.0070 |

| PROBE | GENE SYMBOL | GENE_TITLE | RANK IN GENE LIST | RANK METRIC SCORE | RUNNING ES | CORE ENRICHMENT | |
|---|---|---|---|---|---|---|---|
| 1 | NUP37 | 2947 | 1.800 | -0.1299 | No | ||
| 2 | NUP35 | 3596 | 1.597 | -0.1393 | No | ||
| 3 | U2AF2 | 3837 | 1.528 | -0.1279 | No | ||
| 4 | SFRS9 | 5800 | 1.053 | -0.2167 | No | ||
| 5 | U2AF1 | 5857 | 1.043 | -0.2031 | No | ||
| 6 | NFX1 | 6186 | 0.974 | -0.2052 | No | ||
| 7 | SRRM1 | 8679 | 0.449 | -0.3322 | No | ||
| 8 | NUP62 | 8740 | 0.433 | -0.3285 | No | ||
| 9 | NUP188 | 9487 | 0.265 | -0.3644 | No | ||
| 10 | NUP153 | 10151 | 0.107 | -0.3984 | No | ||
| 11 | NUPL2 | 10655 | -0.023 | -0.4251 | No | ||
| 12 | SLBP | 11826 | -0.324 | -0.4829 | No | ||
| 13 | RAE1 | 12579 | -0.526 | -0.5150 | No | ||
| 14 | RNPS1 | 14036 | -0.969 | -0.5779 | No | ||
| 15 | NCBP2 | 14072 | -0.983 | -0.5641 | No | ||
| 16 | SFRS7 | 14444 | -1.118 | -0.5663 | No | ||
| 17 | RANBP2 | 14634 | -1.188 | -0.5575 | No | ||
| 18 | CPSF1 | 15369 | -1.506 | -0.5730 | No | ||
| 19 | MAGOH | 16256 | -1.972 | -0.5893 | Yes | ||
| 20 | NUP43 | 16552 | -2.179 | -0.5705 | Yes | ||
| 21 | THOC4 | 16562 | -2.186 | -0.5361 | Yes | ||
| 22 | NUP160 | 16813 | -2.361 | -0.5120 | Yes | ||
| 23 | EIF4E | 16832 | -2.371 | -0.4752 | Yes | ||
| 24 | SFRS3 | 17008 | -2.503 | -0.4447 | Yes | ||
| 25 | NUP54 | 17410 | -2.875 | -0.4205 | Yes | ||
| 26 | NUP93 | 17492 | -2.942 | -0.3780 | Yes | ||
| 27 | SFRS5 | 17737 | -3.212 | -0.3399 | Yes | ||
| 28 | SFRS2 | 17780 | -3.269 | -0.2901 | Yes | ||
| 29 | NUP155 | 17958 | -3.526 | -0.2435 | Yes | ||
| 30 | TPR | 17981 | -3.575 | -0.1877 | Yes | ||
| 31 | SFRS6 | 18258 | -4.074 | -0.1377 | Yes | ||
| 32 | SFRS1 | 18407 | -4.486 | -0.0742 | Yes | ||
| 33 | NUP107 | 18555 | -5.358 | 0.0033 | Yes |
