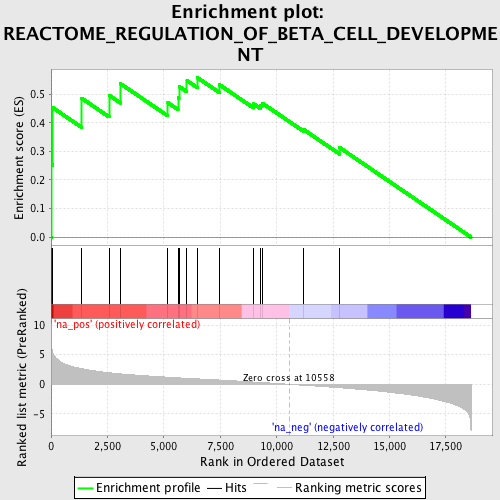
Profile of the Running ES Score & Positions of GeneSet Members on the Rank Ordered List
| Dataset | set03_truncNotch_versus_absentNotch |
| Phenotype | NoPhenotypeAvailable |
| Upregulated in class | na_pos |
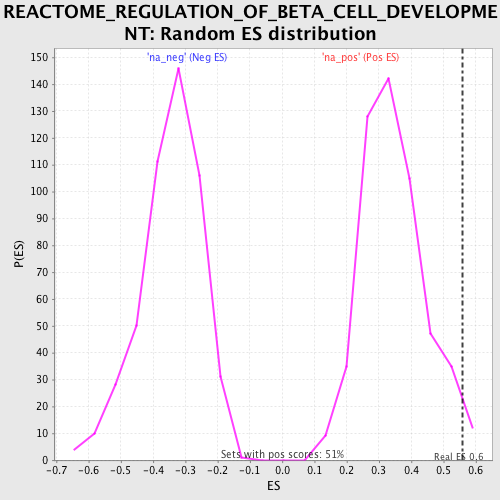
| GeneSet | REACTOME_REGULATION_OF_BETA_CELL_DEVELOPMENT |
| Enrichment Score (ES) | 0.5579664 |
| Normalized Enrichment Score (NES) | 1.6123759 |
| Nominal p-value | 0.021442495 |
| FDR q-value | 0.18026873 |
| FWER p-Value | 0.999 |
| PROBE | GENE SYMBOL | GENE_TITLE | RANK IN GENE LIST | RANK METRIC SCORE | RUNNING ES | CORE ENRICHMENT | |
|---|---|---|---|---|---|---|---|
| 1 | HES1 | 19 | 6.611 | 0.2542 | Yes | ||
| 2 | NOTCH1 | 81 | 5.212 | 0.4522 | Yes | ||
| 3 | ONECUT3 | 1339 | 2.640 | 0.4865 | Yes | ||
| 4 | NEUROD1 | 2572 | 1.961 | 0.4960 | Yes | ||
| 5 | SLC2A2 | 3078 | 1.754 | 0.5366 | Yes | ||
| 6 | IAPP | 5178 | 1.192 | 0.4698 | Yes | ||
| 7 | PTF1A | 5628 | 1.090 | 0.4877 | Yes | ||
| 8 | FGF10 | 5672 | 1.083 | 0.5272 | Yes | ||
| 9 | NKX6-1 | 6023 | 1.011 | 0.5474 | Yes | ||
| 10 | FOXA3 | 6483 | 0.912 | 0.5580 | Yes | ||
| 11 | PDX1 | 7455 | 0.716 | 0.5334 | No | ||
| 12 | INSM1 | 8978 | 0.375 | 0.4661 | No | ||
| 13 | NKX2-2 | 9293 | 0.304 | 0.4609 | No | ||
| 14 | PAX4 | 9353 | 0.291 | 0.4690 | No | ||
| 15 | AKT1 | 11195 | -0.161 | 0.3762 | No | ||
| 16 | HNF4G | 12793 | -0.588 | 0.3130 | No |