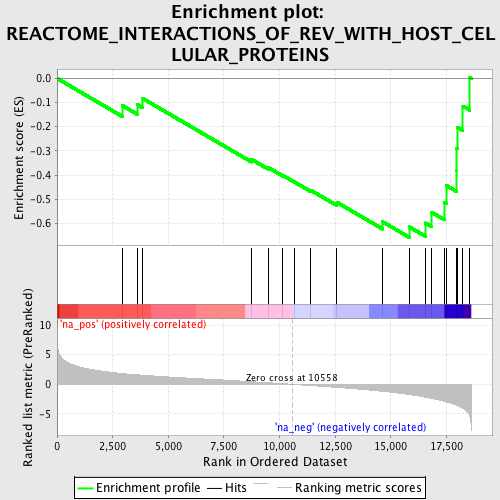
Profile of the Running ES Score & Positions of GeneSet Members on the Rank Ordered List
| Dataset | set03_truncNotch_versus_absentNotch |
| Phenotype | NoPhenotypeAvailable |
| Upregulated in class | na_neg |
| GeneSet | REACTOME_INTERACTIONS_OF_REV_WITH_HOST_CELLULAR_PROTEINS |
| Enrichment Score (ES) | -0.65824735 |
| Normalized Enrichment Score (NES) | -2.0657265 |
| Nominal p-value | 0.0 |
| FDR q-value | 0.00639079 |
| FWER p-Value | 0.048 |
| PROBE | GENE SYMBOL | GENE_TITLE | RANK IN GENE LIST | RANK METRIC SCORE | RUNNING ES | CORE ENRICHMENT | |
|---|---|---|---|---|---|---|---|
| 1 | NUP37 | 2947 | 1.800 | -0.1132 | No | ||
| 2 | NUP35 | 3596 | 1.597 | -0.1079 | No | ||
| 3 | RANGAP1 | 3852 | 1.524 | -0.0833 | No | ||
| 4 | NUP62 | 8740 | 0.433 | -0.3352 | No | ||
| 5 | NUP188 | 9487 | 0.265 | -0.3687 | No | ||
| 6 | NUP153 | 10151 | 0.107 | -0.4017 | No | ||
| 7 | NUPL2 | 10655 | -0.023 | -0.4281 | No | ||
| 8 | XPO1 | 11398 | -0.210 | -0.4628 | No | ||
| 9 | RAE1 | 12579 | -0.526 | -0.5130 | No | ||
| 10 | RANBP2 | 14634 | -1.188 | -0.5936 | No | ||
| 11 | RAN | 15838 | -1.728 | -0.6148 | Yes | ||
| 12 | NUP43 | 16552 | -2.179 | -0.5984 | Yes | ||
| 13 | NUP160 | 16813 | -2.361 | -0.5530 | Yes | ||
| 14 | NUP54 | 17410 | -2.875 | -0.5128 | Yes | ||
| 15 | NUP93 | 17492 | -2.942 | -0.4432 | Yes | ||
| 16 | NUP155 | 17958 | -3.526 | -0.3796 | Yes | ||
| 17 | RANBP1 | 17962 | -3.537 | -0.2909 | Yes | ||
| 18 | TPR | 17981 | -3.575 | -0.2020 | Yes | ||
| 19 | KPNB1 | 18242 | -4.033 | -0.1146 | Yes | ||
| 20 | NUP107 | 18555 | -5.358 | 0.0033 | Yes |
