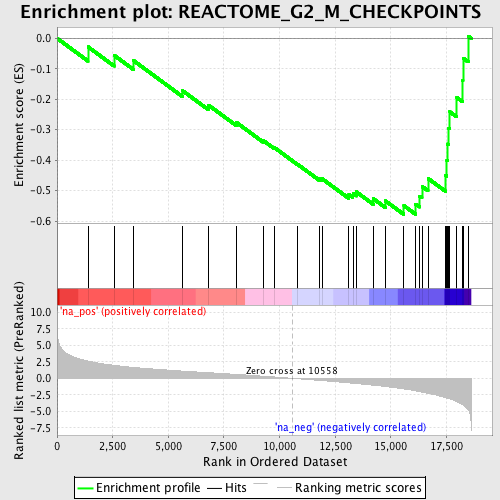
Profile of the Running ES Score & Positions of GeneSet Members on the Rank Ordered List
| Dataset | set03_truncNotch_versus_absentNotch |
| Phenotype | NoPhenotypeAvailable |
| Upregulated in class | na_neg |
| GeneSet | REACTOME_G2_M_CHECKPOINTS |
| Enrichment Score (ES) | -0.5785482 |
| Normalized Enrichment Score (NES) | -2.0275111 |
| Nominal p-value | 0.0 |
| FDR q-value | 0.009099191 |
| FWER p-Value | 0.088 |
| PROBE | GENE SYMBOL | GENE_TITLE | RANK IN GENE LIST | RANK METRIC SCORE | RUNNING ES | CORE ENRICHMENT | |
|---|---|---|---|---|---|---|---|
| 1 | ORC2L | 1389 | 2.606 | -0.0280 | No | ||
| 2 | RFC5 | 2562 | 1.966 | -0.0557 | No | ||
| 3 | RPA2 | 3444 | 1.646 | -0.0736 | No | ||
| 4 | CDC45L | 5635 | 1.089 | -0.1718 | No | ||
| 5 | MCM5 | 6802 | 0.851 | -0.2193 | No | ||
| 6 | ATM | 8057 | 0.588 | -0.2762 | No | ||
| 7 | CDC25C | 9276 | 0.307 | -0.3362 | No | ||
| 8 | RAD1 | 9753 | 0.202 | -0.3582 | No | ||
| 9 | MCM2 | 10789 | -0.062 | -0.4128 | No | ||
| 10 | MCM10 | 11800 | -0.317 | -0.4614 | No | ||
| 11 | CCNB2 | 11908 | -0.344 | -0.4610 | No | ||
| 12 | MCM7 | 13115 | -0.680 | -0.5137 | No | ||
| 13 | RAD9B | 13299 | -0.741 | -0.5102 | No | ||
| 14 | MCM3 | 13442 | -0.780 | -0.5039 | No | ||
| 15 | ORC4L | 14209 | -1.032 | -0.5266 | No | ||
| 16 | RFC4 | 14756 | -1.230 | -0.5338 | No | ||
| 17 | CHEK1 | 15588 | -1.603 | -0.5498 | Yes | ||
| 18 | ORC1L | 16116 | -1.893 | -0.5441 | Yes | ||
| 19 | RFC3 | 16301 | -2.003 | -0.5181 | Yes | ||
| 20 | CDC25A | 16402 | -2.075 | -0.4862 | Yes | ||
| 21 | WEE1 | 16673 | -2.258 | -0.4602 | Yes | ||
| 22 | MCM6 | 17467 | -2.920 | -0.4505 | Yes | ||
| 23 | RPA3 | 17519 | -2.986 | -0.3996 | Yes | ||
| 24 | RPA1 | 17548 | -3.013 | -0.3470 | Yes | ||
| 25 | CCNB1 | 17604 | -3.068 | -0.2949 | Yes | ||
| 26 | ORC5L | 17652 | -3.115 | -0.2415 | Yes | ||
| 27 | MCM4 | 17966 | -3.547 | -0.1947 | Yes | ||
| 28 | CDK2 | 18234 | -4.014 | -0.1370 | Yes | ||
| 29 | CDC7 | 18245 | -4.038 | -0.0650 | Yes | ||
| 30 | HUS1 | 18481 | -4.731 | 0.0073 | Yes |
