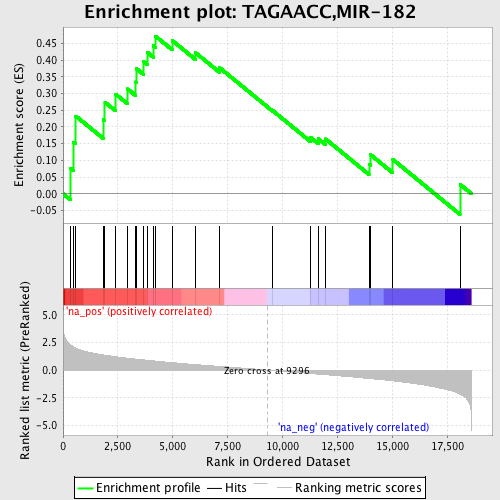
Profile of the Running ES Score & Positions of GeneSet Members on the Rank Ordered List
| Dataset | set03_absentNotch_versus_wtNotch |
| Phenotype | NoPhenotypeAvailable |
| Upregulated in class | na_pos |
| GeneSet | TAGAACC,MIR-182 |
| Enrichment Score (ES) | 0.47182932 |
| Normalized Enrichment Score (NES) | 1.5700067 |
| Nominal p-value | 0.026804123 |
| FDR q-value | 0.3344555 |
| FWER p-Value | 0.85 |
| PROBE | GENE SYMBOL | GENE_TITLE | RANK IN GENE LIST | RANK METRIC SCORE | RUNNING ES | CORE ENRICHMENT | |
|---|---|---|---|---|---|---|---|
| 1 | SLC6A4 | 343 | 2.268 | 0.0759 | Yes | ||
| 2 | RBM12 | 484 | 2.081 | 0.1550 | Yes | ||
| 3 | BCL2L2 | 579 | 1.986 | 0.2326 | Yes | ||
| 4 | GALNT1 | 1839 | 1.366 | 0.2217 | Yes | ||
| 5 | CNTN2 | 1908 | 1.346 | 0.2741 | Yes | ||
| 6 | TBR1 | 2390 | 1.210 | 0.2986 | Yes | ||
| 7 | DDX3X | 2936 | 1.071 | 0.3138 | Yes | ||
| 8 | ZFP36L2 | 3318 | 0.992 | 0.3346 | Yes | ||
| 9 | RNF6 | 3328 | 0.990 | 0.3753 | Yes | ||
| 10 | BAAT | 3668 | 0.922 | 0.3955 | Yes | ||
| 11 | RAB5A | 3829 | 0.888 | 0.4238 | Yes | ||
| 12 | HDHD2 | 4110 | 0.832 | 0.4434 | Yes | ||
| 13 | CRIM1 | 4209 | 0.811 | 0.4718 | Yes | ||
| 14 | SFRS1 | 4978 | 0.672 | 0.4585 | No | ||
| 15 | DOCK9 | 6035 | 0.495 | 0.4223 | No | ||
| 16 | SLC16A7 | 7133 | 0.335 | 0.3772 | No | ||
| 17 | FLI1 | 9557 | -0.040 | 0.2486 | No | ||
| 18 | UBE2B | 11267 | -0.300 | 0.1691 | No | ||
| 19 | CXXC5 | 11629 | -0.360 | 0.1647 | No | ||
| 20 | ACYP1 | 11962 | -0.416 | 0.1641 | No | ||
| 21 | CREM | 13944 | -0.753 | 0.0889 | No | ||
| 22 | FUSIP1 | 14003 | -0.765 | 0.1176 | No | ||
| 23 | NUP153 | 15030 | -0.969 | 0.1028 | No | ||
| 24 | HOXB4 | 18091 | -2.164 | 0.0282 | No |
