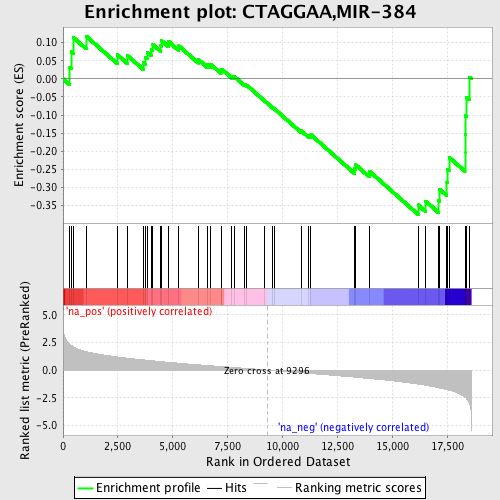
Profile of the Running ES Score & Positions of GeneSet Members on the Rank Ordered List
| Dataset | set03_absentNotch_versus_wtNotch |
| Phenotype | NoPhenotypeAvailable |
| Upregulated in class | na_neg |
| GeneSet | CTAGGAA,MIR-384 |
| Enrichment Score (ES) | -0.3750947 |
| Normalized Enrichment Score (NES) | -1.4006971 |
| Nominal p-value | 0.0734767 |
| FDR q-value | 0.4990176 |
| FWER p-Value | 1.0 |
| PROBE | GENE SYMBOL | GENE_TITLE | RANK IN GENE LIST | RANK METRIC SCORE | RUNNING ES | CORE ENRICHMENT | |
|---|---|---|---|---|---|---|---|
| 1 | CD200 | 305 | 2.326 | 0.0324 | No | ||
| 2 | NCAM1 | 374 | 2.217 | 0.0753 | No | ||
| 3 | METAP2 | 473 | 2.096 | 0.1141 | No | ||
| 4 | ELL3 | 1051 | 1.676 | 0.1182 | No | ||
| 5 | IL17RC | 2465 | 1.191 | 0.0671 | No | ||
| 6 | DDX3X | 2936 | 1.071 | 0.0643 | No | ||
| 7 | PRKACB | 3666 | 0.923 | 0.0444 | No | ||
| 8 | ACVR1 | 3740 | 0.909 | 0.0596 | No | ||
| 9 | HAO1 | 3827 | 0.888 | 0.0736 | No | ||
| 10 | THBD | 4010 | 0.851 | 0.0817 | No | ||
| 11 | AQP4 | 4091 | 0.835 | 0.0949 | No | ||
| 12 | LAMC1 | 4456 | 0.765 | 0.0914 | No | ||
| 13 | RIMS2 | 4486 | 0.761 | 0.1058 | No | ||
| 14 | ESRRG | 4810 | 0.702 | 0.1031 | No | ||
| 15 | HDGF | 5277 | 0.619 | 0.0911 | No | ||
| 16 | CHRD | 6158 | 0.476 | 0.0537 | No | ||
| 17 | GPR83 | 6570 | 0.417 | 0.0403 | No | ||
| 18 | GPM6B | 6722 | 0.394 | 0.0405 | No | ||
| 19 | UNC5C | 7198 | 0.326 | 0.0217 | No | ||
| 20 | PTN | 7231 | 0.323 | 0.0268 | No | ||
| 21 | SLC35F1 | 7694 | 0.256 | 0.0073 | No | ||
| 22 | SYTL2 | 7798 | 0.237 | 0.0067 | No | ||
| 23 | PICALM | 8280 | 0.162 | -0.0158 | No | ||
| 24 | CUGBP2 | 8371 | 0.149 | -0.0175 | No | ||
| 25 | EPC2 | 9170 | 0.019 | -0.0601 | No | ||
| 26 | GFRA2 | 9559 | -0.040 | -0.0801 | No | ||
| 27 | VDP | 9625 | -0.050 | -0.0826 | No | ||
| 28 | ARFIP2 | 10852 | -0.240 | -0.1435 | No | ||
| 29 | SFRS7 | 11184 | -0.287 | -0.1553 | No | ||
| 30 | YY1 | 11296 | -0.305 | -0.1549 | No | ||
| 31 | NLK | 13271 | -0.634 | -0.2479 | No | ||
| 32 | RIMS4 | 13331 | -0.643 | -0.2376 | No | ||
| 33 | CHES1 | 13953 | -0.755 | -0.2551 | No | ||
| 34 | EXOC5 | 16182 | -1.260 | -0.3486 | Yes | ||
| 35 | SIX4 | 16515 | -1.366 | -0.3378 | Yes | ||
| 36 | ATP2C1 | 17097 | -1.585 | -0.3358 | Yes | ||
| 37 | GTF2B | 17170 | -1.614 | -0.3058 | Yes | ||
| 38 | POM121 | 17492 | -1.748 | -0.2864 | Yes | ||
| 39 | DCTN5 | 17508 | -1.756 | -0.2503 | Yes | ||
| 40 | PTGER2 | 17592 | -1.805 | -0.2169 | Yes | ||
| 41 | BRE | 18318 | -2.446 | -0.2045 | Yes | ||
| 42 | SLC39A14 | 18320 | -2.449 | -0.1532 | Yes | ||
| 43 | MOSPD1 | 18330 | -2.464 | -0.1019 | Yes | ||
| 44 | ERBB2IP | 18390 | -2.574 | -0.0510 | Yes | ||
| 45 | UBE2E3 | 18521 | -3.007 | 0.0051 | Yes |
