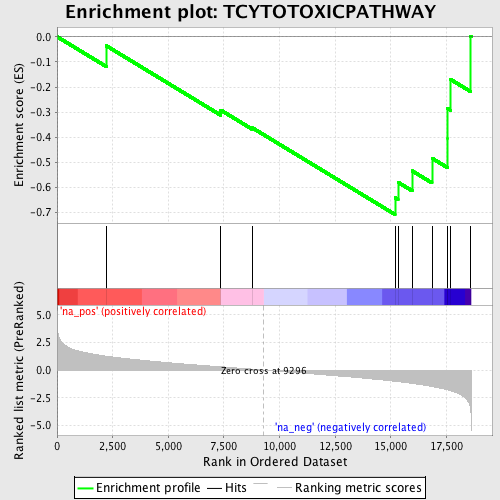
Profile of the Running ES Score & Positions of GeneSet Members on the Rank Ordered List
| Dataset | set03_absentNotch_versus_wtNotch |
| Phenotype | NoPhenotypeAvailable |
| Upregulated in class | na_neg |
| GeneSet | TCYTOTOXICPATHWAY |
| Enrichment Score (ES) | -0.70714474 |
| Normalized Enrichment Score (NES) | -1.8361009 |
| Nominal p-value | 0.0059288535 |
| FDR q-value | 0.30098918 |
| FWER p-Value | 0.792 |
| PROBE | GENE SYMBOL | GENE_TITLE | RANK IN GENE LIST | RANK METRIC SCORE | RUNNING ES | CORE ENRICHMENT | |
|---|---|---|---|---|---|---|---|
| 1 | CD28 | 2213 | 1.256 | -0.0360 | No | ||
| 2 | PTPRC | 7351 | 0.307 | -0.2917 | No | ||
| 3 | THY1 | 8779 | 0.087 | -0.3627 | No | ||
| 4 | CD3E | 15189 | -1.008 | -0.6405 | Yes | ||
| 5 | ITGAL | 15325 | -1.039 | -0.5791 | Yes | ||
| 6 | TRB@ | 15960 | -1.203 | -0.5337 | Yes | ||
| 7 | CD2 | 16851 | -1.485 | -0.4834 | Yes | ||
| 8 | CD3G | 17550 | -1.778 | -0.4034 | Yes | ||
| 9 | ITGB2 | 17553 | -1.780 | -0.2858 | Yes | ||
| 10 | CD3D | 17693 | -1.861 | -0.1703 | Yes | ||
| 11 | ICAM1 | 18571 | -3.326 | 0.0024 | Yes |
