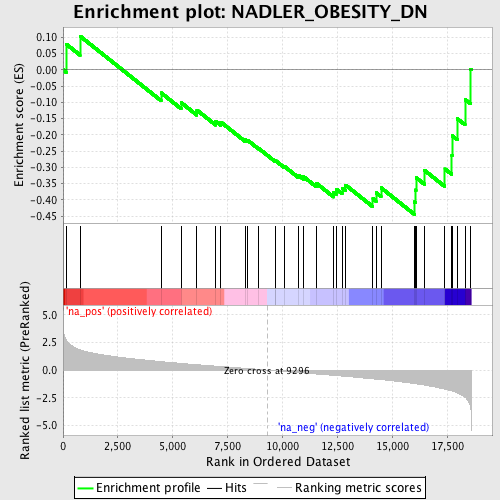
Profile of the Running ES Score & Positions of GeneSet Members on the Rank Ordered List
| Dataset | set03_absentNotch_versus_wtNotch |
| Phenotype | NoPhenotypeAvailable |
| Upregulated in class | na_neg |
| GeneSet | NADLER_OBESITY_DN |
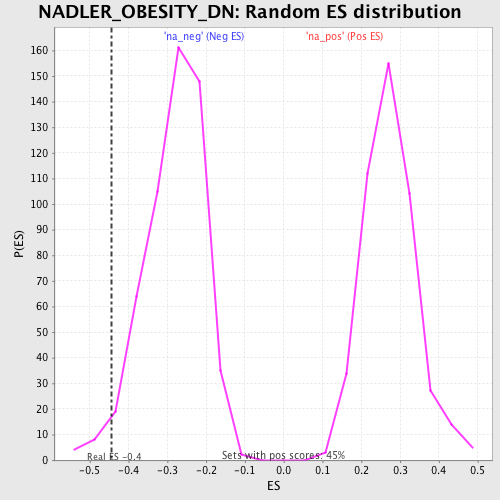
| Enrichment Score (ES) | -0.44500202 |
| Normalized Enrichment Score (NES) | -1.5743805 |
| Nominal p-value | 0.025641026 |
| FDR q-value | 0.86365426 |
| FWER p-Value | 1.0 |
| PROBE | GENE SYMBOL | GENE_TITLE | RANK IN GENE LIST | RANK METRIC SCORE | RUNNING ES | CORE ENRICHMENT | |
|---|---|---|---|---|---|---|---|
| 1 | APOE | 140 | 2.722 | 0.0791 | No | ||
| 2 | GPD2 | 772 | 1.836 | 0.1036 | No | ||
| 3 | THRSP | 4468 | 0.763 | -0.0709 | No | ||
| 4 | HP | 5380 | 0.600 | -0.1009 | No | ||
| 5 | AGT | 6097 | 0.486 | -0.1239 | No | ||
| 6 | BCAT2 | 6955 | 0.358 | -0.1586 | No | ||
| 7 | GSTA3 | 7186 | 0.327 | -0.1606 | No | ||
| 8 | FDFT1 | 8290 | 0.160 | -0.2149 | No | ||
| 9 | CFD | 8419 | 0.143 | -0.2172 | No | ||
| 10 | RBP4 | 8914 | 0.063 | -0.2418 | No | ||
| 11 | GBE1 | 9670 | -0.056 | -0.2807 | No | ||
| 12 | FMO1 | 9698 | -0.060 | -0.2802 | No | ||
| 13 | ALDH2 | 10095 | -0.123 | -0.2976 | No | ||
| 14 | FABP4 | 10746 | -0.227 | -0.3254 | No | ||
| 15 | RASD1 | 10953 | -0.254 | -0.3284 | No | ||
| 16 | CDKN2C | 11540 | -0.347 | -0.3489 | No | ||
| 17 | SOD1 | 12328 | -0.474 | -0.3761 | No | ||
| 18 | C2 | 12446 | -0.493 | -0.3667 | No | ||
| 19 | COX8A | 12717 | -0.541 | -0.3640 | No | ||
| 20 | ADRB3 | 12875 | -0.566 | -0.3545 | No | ||
| 21 | DBI | 14122 | -0.789 | -0.3964 | No | ||
| 22 | NNAT | 14266 | -0.815 | -0.3781 | No | ||
| 23 | UBB | 14492 | -0.857 | -0.3629 | No | ||
| 24 | EEF1A1 | 16018 | -1.216 | -0.4063 | Yes | ||
| 25 | PCK1 | 16062 | -1.226 | -0.3696 | Yes | ||
| 26 | ASNS | 16086 | -1.234 | -0.3316 | Yes | ||
| 27 | DDT | 16476 | -1.351 | -0.3095 | Yes | ||
| 28 | PYGB | 17404 | -1.708 | -0.3050 | Yes | ||
| 29 | SREBF1 | 17718 | -1.874 | -0.2622 | Yes | ||
| 30 | UCK1 | 17732 | -1.886 | -0.2029 | Yes | ||
| 31 | TSHR | 17968 | -2.047 | -0.1504 | Yes | ||
| 32 | ALDOA | 18321 | -2.455 | -0.0912 | Yes | ||
| 33 | B2M | 18574 | -3.363 | 0.0023 | Yes |