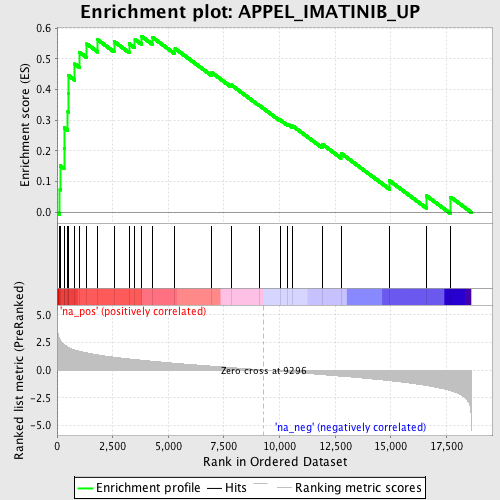
Profile of the Running ES Score & Positions of GeneSet Members on the Rank Ordered List
| Dataset | set03_absentNotch_versus_wtNotch |
| Phenotype | NoPhenotypeAvailable |
| Upregulated in class | na_pos |
| GeneSet | APPEL_IMATINIB_UP |
| Enrichment Score (ES) | 0.57422465 |
| Normalized Enrichment Score (NES) | 1.9744853 |
| Nominal p-value | 0.0 |
| FDR q-value | 0.061342623 |
| FWER p-Value | 0.294 |
| PROBE | GENE SYMBOL | GENE_TITLE | RANK IN GENE LIST | RANK METRIC SCORE | RUNNING ES | CORE ENRICHMENT | |
|---|---|---|---|---|---|---|---|
| 1 | ASAH1 | 128 | 2.763 | 0.0733 | Yes | ||
| 2 | APOE | 140 | 2.722 | 0.1518 | Yes | ||
| 3 | CTSZ | 312 | 2.311 | 0.2097 | Yes | ||
| 4 | CTSH | 324 | 2.295 | 0.2757 | Yes | ||
| 5 | APOC1 | 486 | 2.080 | 0.3275 | Yes | ||
| 6 | NEU1 | 503 | 2.063 | 0.3865 | Yes | ||
| 7 | CTSD | 511 | 2.056 | 0.4459 | Yes | ||
| 8 | CD68 | 795 | 1.821 | 0.4835 | Yes | ||
| 9 | LAMP1 | 1010 | 1.697 | 0.5213 | Yes | ||
| 10 | PPARG | 1339 | 1.551 | 0.5487 | Yes | ||
| 11 | HEXA | 1831 | 1.368 | 0.5620 | Yes | ||
| 12 | PLSCR1 | 2562 | 1.167 | 0.5566 | Yes | ||
| 13 | OSBPL3 | 3243 | 1.009 | 0.5493 | Yes | ||
| 14 | LAMP2 | 3499 | 0.956 | 0.5634 | Yes | ||
| 15 | PLD1 | 3783 | 0.899 | 0.5742 | Yes | ||
| 16 | CTSB | 4279 | 0.800 | 0.5708 | No | ||
| 17 | GNS | 5297 | 0.616 | 0.5340 | No | ||
| 18 | C5AR1 | 6959 | 0.358 | 0.4550 | No | ||
| 19 | HEXB | 7825 | 0.232 | 0.4153 | No | ||
| 20 | GM2A | 9076 | 0.033 | 0.3490 | No | ||
| 21 | GBA | 10024 | -0.111 | 0.3013 | No | ||
| 22 | APOD | 10377 | -0.169 | 0.2872 | No | ||
| 23 | ENG | 10589 | -0.199 | 0.2816 | No | ||
| 24 | FUCA1 | 11921 | -0.408 | 0.2219 | No | ||
| 25 | CD163 | 12762 | -0.549 | 0.1926 | No | ||
| 26 | RARRES1 | 14939 | -0.951 | 0.1032 | No | ||
| 27 | MSR1 | 16609 | -1.394 | 0.0539 | No | ||
| 28 | ACP5 | 17689 | -1.861 | 0.0499 | No |
