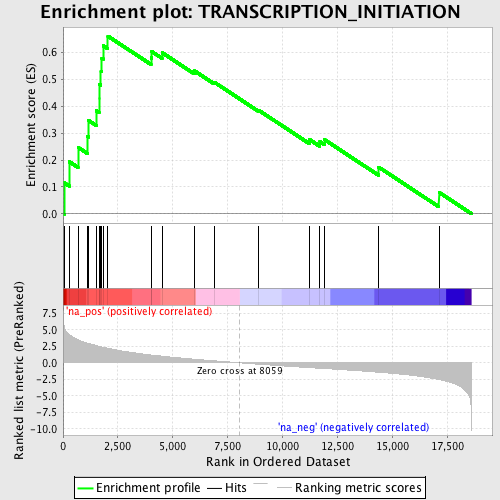
Profile of the Running ES Score & Positions of GeneSet Members on the Rank Ordered List
| Dataset | set03_absentNotch_versus_truncNotch |
| Phenotype | NoPhenotypeAvailable |
| Upregulated in class | na_pos |
| GeneSet | TRANSCRIPTION_INITIATION |
| Enrichment Score (ES) | 0.6607705 |
| Normalized Enrichment Score (NES) | 2.0815392 |
| Nominal p-value | 0.002079002 |
| FDR q-value | 0.012590674 |
| FWER p-Value | 0.066 |

| PROBE | GENE SYMBOL | GENE_TITLE | RANK IN GENE LIST | RANK METRIC SCORE | RUNNING ES | CORE ENRICHMENT | |
|---|---|---|---|---|---|---|---|
| 1 | GTF2I | 47 | 5.525 | 0.1155 | Yes | ||
| 2 | TAF5 | 283 | 4.253 | 0.1937 | Yes | ||
| 3 | GTF2E1 | 683 | 3.496 | 0.2470 | Yes | ||
| 4 | SNAPC5 | 1104 | 2.967 | 0.2878 | Yes | ||
| 5 | NCOA6 | 1153 | 2.917 | 0.3475 | Yes | ||
| 6 | GTF3C4 | 1516 | 2.586 | 0.3833 | Yes | ||
| 7 | MED12 | 1641 | 2.479 | 0.4296 | Yes | ||
| 8 | TBP | 1642 | 2.479 | 0.4825 | Yes | ||
| 9 | E2F2 | 1725 | 2.416 | 0.5298 | Yes | ||
| 10 | RSF1 | 1765 | 2.387 | 0.5787 | Yes | ||
| 11 | GTF2E2 | 1827 | 2.342 | 0.6254 | Yes | ||
| 12 | E2F3 | 2042 | 2.193 | 0.6608 | Yes | ||
| 13 | PPARGC1A | 4010 | 1.174 | 0.5801 | No | ||
| 14 | BRF1 | 4042 | 1.163 | 0.6032 | No | ||
| 15 | MED4 | 4512 | 0.995 | 0.5993 | No | ||
| 16 | GTF2F1 | 5987 | 0.540 | 0.5315 | No | ||
| 17 | GTF2F2 | 6887 | 0.294 | 0.4895 | No | ||
| 18 | SMARCA5 | 8915 | -0.212 | 0.3850 | No | ||
| 19 | PTRF | 11224 | -0.730 | 0.2764 | No | ||
| 20 | THRAP3 | 11703 | -0.827 | 0.2684 | No | ||
| 21 | CDK7 | 11914 | -0.871 | 0.2757 | No | ||
| 22 | CDK9 | 14383 | -1.427 | 0.1735 | No | ||
| 23 | MAZ | 17132 | -2.534 | 0.0798 | No |
